Virgin Media 2012 Annual Report Download - page 174
Download and view the complete annual report
Please find page 174 of the 2012 Virgin Media annual report below. You can navigate through the pages in the report by either clicking on the pages listed below, or by using the keyword search tool below to find specific information within the annual report.-
 1
1 -
2
-
3
-
4
-
5
-
6
-
7
-
8
-
9
-
10
-
11
-
12
-
13
-
14
-
15
-
16
-
17
-
18
-
19
-
20
-
21
-
22
-
23
-
24
-
25
-
26
-
27
-
28
-
29
-
30
-
31
-
32
-
33
-
34
-
35
-
36
-
37
-
38
-
39
-
40
-
41
-
42
-
43
-
44
-
45
-
46
-
47
-
48
-
49
-
50
-
51
-
52
-
53
-
54
-
55
-
56
-
57
-
58
-
59
-
60
-
61
-
62
-
63
-
64
-
65
-
66
-
67
-
68
-
69
-
70
-
71
-
72
-
73
-
74
-
75
-
76
-
77
-
78
-
79
-
80
-
81
-
82
-
83
-
84
-
85
-
86
-
87
-
88
-
89
-
90
-
91
-
92
-
93
-
94
-
95
-
96
-
97
-
98
-
99
-
100
-
101
-
102
-
103
-
104
-
105
-
106
-
107
-
108
-
109
-
110
-
111
-
112
-
113
-
114
-
115
-
116
-
117
-
118
-
119
-
120
-
121
-
122
-
123
-
124
-
125
-
126
-
127
-
128
-
129
-
130
-
131
-
132
-
133
-
134
-
135
-
136
-
137
-
138
-
139
-
140
-
141
-
142
-
143
-
144
-
145
-
146
-
147
-
148
-
149
-
150
-
151
-
152
-
153
-
154
-
155
-
156
-
157
-
158
-
159
-
160
-
161
-
162
-
163
-
 164
164 -
 165
165 -
 166
166 -
 167
167 -
 168
168 -
 169
169 -
 170
170 -
 171
171 -
 172
172 -
 173
173 -
 174
174 -
 175
175 -
 176
176 -
 177
177 -
 178
178 -
 179
179 -
 180
180 -
 181
181 -
 182
182 -
 183
183 -
 184
184 -
185
-
186
-
187
-
188
-
189
-
190
-
191
-
192
-
193
-
194
-
195
-
196
-
197
 |
 |

F-103
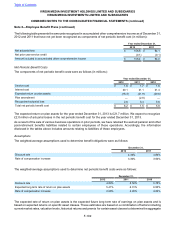
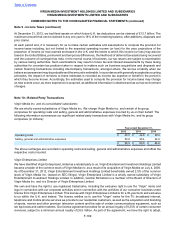
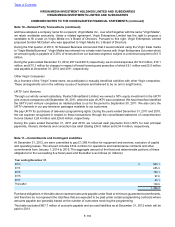
return for the plan assets. The projected return is then weighted according to the asset allocation of the overall plan
assets.
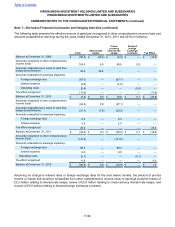
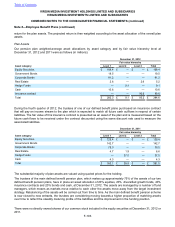
Plan Assets
Our pension plan weighted-average asset allocations by asset category and by fair value hierarchy level at
December 31, 2012 and 2011 were as follows (in millions):
December 31, 2012
Fair value hierarchy
Asset category Level 1 Level 2 Level 3 Total
Equity Securities £ 168.4 £ — £ — £ 168.4
Government Bonds 19.5 — — 19.5
Corporate Bonds 81.2 — — 81.2
Real Estate 2.6 — 2.6 5.2
Hedge Funds — 9.1 — 9.1
Cash 10.6 — — 10.6
Insurance contract — — 90.6 90.6
Total £ 282.3 £ 9.1 £ 93.2 £ 384.6
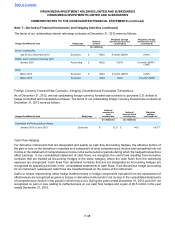
During the fourth quarter of 2012, the trustees of one of our defined benefit plans purchased an insurance contract
that will pay an income stream to the plan which is expected to match all future cash outflows in respect of certain
liabilities. The fair value of this insurance contract is presented as an asset of the plan and is measured based on the
future cash flows to be received under the contract discounted using the same discount rate used to measure the
associated liabilities.
December 31, 2011
Fair value hierarchy
Asset category Level 1 Level 2 Level 3 Total
Equity Securities £ 125.4 £ — £ — £ 125.4
Government Bonds 142.7 — — 142.7
Corporate Bonds 75.0 — — 75.0
Real Estate 4.7 1.9 — 6.6
Hedge Funds — 27.0 — 27.0
Cash 4.3 — — 4.3
Total £ 352.1 £ 28.9 £ — £ 381.0
The substantial majority of plan assets are valued using quoted prices for the holding.
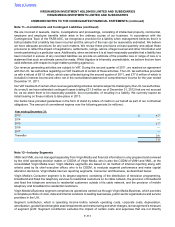
The trustees of the main defined benefit pension plan, which makes up approximately 75% of the assets of our two
defined benefit pension plans, have in place an asset allocation of 20% equities, 20% diversified growth funds, 40%
insurance contracts and 20% bonds and cash, at December 31, 2012. The assets are managed by a number of fund
managers, which means as markets move relative to each other the assets move away from the target investment
strategy. Rebalancing of the assets will be carried out from time to time. As the main defined benefit pension scheme
is now closed to new entrants, the trustees are considering moving towards a higher proportion of matching assets
over time to reflect the steadily maturing profile of the liabilities and the improvement in the funding position.
There were no directly owned shares of our common stock included in the equity securities at December 31, 2012 or
2011.
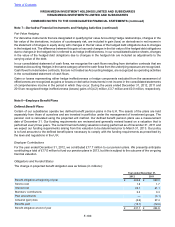
Table of Contents
VIRGIN MEDIA INVESTMENT HOLDINGS LIMITED AND SUBSIDIARIES
VIRGIN MEDIA INVESTMENTS LIMITED AND SUBSIDIARIES
COMBINED NOTES TO THE CONSOLIDATED FINANCIAL STATEMENTS (continued)
Note 8—Employee Benefit Plans (continued)