Virgin Media 2012 Annual Report Download - page 109
Download and view the complete annual report
Please find page 109 of the 2012 Virgin Media annual report below. You can navigate through the pages in the report by either clicking on the pages listed below, or by using the keyword search tool below to find specific information within the annual report.-
 1
1 -
2
-
3
-
4
-
5
-
6
-
7
-
8
-
9
-
10
-
11
-
12
-
13
-
14
-
15
-
16
-
17
-
18
-
19
-
20
-
21
-
22
-
23
-
24
-
25
-
26
-
27
-
28
-
29
-
30
-
31
-
32
-
33
-
34
-
35
-
36
-
37
-
38
-
39
-
40
-
41
-
42
-
43
-
44
-
45
-
46
-
47
-
48
-
49
-
50
-
51
-
52
-
53
-
54
-
55
-
56
-
57
-
58
-
59
-
60
-
61
-
62
-
63
-
64
-
65
-
66
-
67
-
68
-
69
-
70
-
71
-
72
-
73
-
74
-
75
-
76
-
77
-
78
-
79
-
80
-
81
-
82
-
83
-
84
-
85
-
86
-
87
-
88
-
89
-
90
-
91
-
92
-
93
-
94
-
95
-
96
-
97
-
98
-
 99
99 -
 100
100 -
 101
101 -
 102
102 -
 103
103 -
 104
104 -
 105
105 -
 106
106 -
 107
107 -
 108
108 -
 109
109 -
 110
110 -
 111
111 -
 112
112 -
 113
113 -
 114
114 -
 115
115 -
 116
116 -
 117
117 -
 118
118 -
 119
119 -
120
-
121
-
122
-
123
-
124
-
125
-
126
-
127
-
128
-
129
-
130
-
131
-
132
-
133
-
134
-
135
-
136
-
137
-
138
-
139
-
140
-
141
-
142
-
143
-
144
-
145
-
146
-
147
-
148
-
149
-
150
-
151
-
152
-
153
-
154
-
155
-
156
-
157
-
158
-
159
-
160
-
161
-
162
-
163
-
164
-
165
-
166
-
167
-
168
-
169
-
170
-
171
-
172
-
173
-
174
-
175
-
176
-
177
-
178
-
179
-
180
-
181
-
182
-
183
-
184
-
185
-
186
-
187
-
188
-
189
-
190
-
191
-
192
-
193
-
194
-
195
-
196
-
197
 |
 |

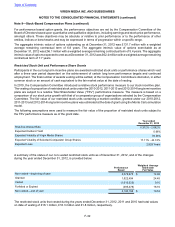
F-38
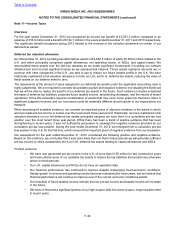
Overview
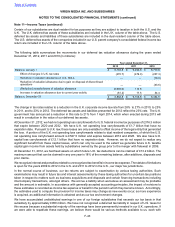
For the year ended December 31, 2012 we recognized an income tax benefit of £2,591.2 million compared to an
expense of £16.0 million and a benefit of £124.1 million in the years ended December 31, 2011 and 2010 respectively.
The significant benefit recognized during 2012 related to the reversal of the valuation allowance on certain of our
deferred tax assets.
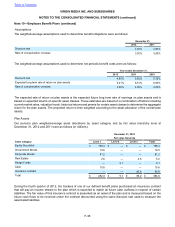
Deferred tax valuation allowance
As of December 31, 2012 we had gross deferred tax assets of £5,682.5 million of which £5,359.2 million related to the
U.K. and which principally comprised capital allowances, net operating losses, or NOLs, and capital losses. We
accumulated these assets over the last two decades as we made significant investments in building our network
infrastructure and incurred significant losses as we operated that network. These assets represent amounts we, in
common with other companies in the U.K., are able to use to reduce our future taxable profits in the U.K. We have
historically maintained a full valuation allowance on both our U.K. and U.S. deferred tax assets, reducing the value of
these assets on our balance sheet to zero.
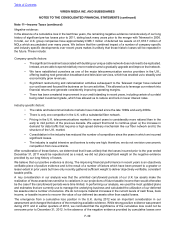
The assessment of the amount of value assigned to our deferred tax assets under the applicable accounting rules is
highly judgmental. We are required to consider all available positive and negative evidence in evaluating the likelihood
that we will be able to realize the benefit of our deferred tax assets in the future. Such evidence includes scheduled
reversals of deferred tax liabilities, projected future taxable income, tax-planning strategies, and the results of recent
operations. Since this evaluation requires consideration of events that may occur some years into the future, there is
significant judgment involved, and our conclusion could be materially different should certain of our expectations not
transpire.
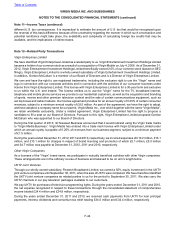
When assessing all available evidence, we consider an important piece of objective evidence is the extent to which
we have made pre-tax income or losses over the most recent three year period. Historically, we have maintained a full
valuation allowance on our net deferred tax assets principally because we have been in a cumulative pre-tax loss
position over the most recent three year period. While there has been a trend of positive evidence that has been
strengthening in recent years, it was not sufficiently persuasive to outweigh the negative evidence provided by our
cumulative pre-tax loss position. During the year ended December 31, 2012, we emerged from a cumulative pre-tax
loss position in the U.K. for the first time, which removed this important piece of negative evidence from our evaluation.
Our assessment for the year ended December 31, 2012 considered the following positive and negative evidence.
Based on this evidence, we concluded that it was more likely than not that in future periods we will generate sufficient
pre-tax income to utilize substantially all of our U.K. deferred tax assets relating to capital allowances and NOLs:
Positive evidence:
• We have now generated pre-tax income in the U.K. of more than £150 million for two consecutive years
and have utilized some of our available tax assets to reduce the tax liabilities that would have otherwise
arisen in those periods.
• Our U.K. capital allowances and NOLs do not have an expiration date.
• Our financial performance has continued to improve despite challenging macroeconomic conditions.
Steady growth in revenue and operating income has been maintained for three years, and we believe that
financial performance will continue to improve even if the current economic conditions persist.
• Our forecasts of future taxable income indicate that our pre-tax income and taxable income will increase
in the future.
• We have re-financed a significant portion of our high-coupon debt into lower-coupon, longer duration debt
in recent years.
Table of Contents
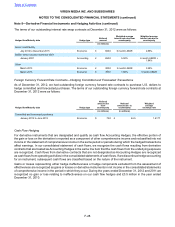
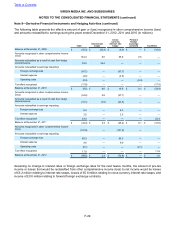
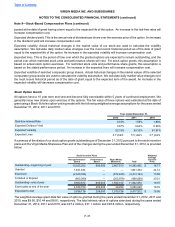
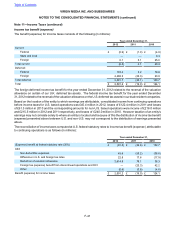
VIRGIN MEDIA INC. AND SUBSIDIARIES
NOTES TO THE CONSOLIDATED FINANCIAL STATEMENTS (continued)
Note 11—Income Taxes