Virgin Media 2012 Annual Report Download - page 45
Download and view the complete annual report
Please find page 45 of the 2012 Virgin Media annual report below. You can navigate through the pages in the report by either clicking on the pages listed below, or by using the keyword search tool below to find specific information within the annual report.-
 1
1 -
2
-
3
-
4
-
5
-
6
-
7
-
8
-
9
-
10
-
11
-
12
-
13
-
14
-
15
-
16
-
17
-
18
-
19
-
20
-
21
-
22
-
23
-
24
-
25
-
26
-
27
-
28
-
29
-
30
-
31
-
32
-
33
-
34
-
 35
35 -
 36
36 -
 37
37 -
 38
38 -
 39
39 -
 40
40 -
 41
41 -
 42
42 -
 43
43 -
 44
44 -
 45
45 -
 46
46 -
 47
47 -
 48
48 -
 49
49 -
 50
50 -
 51
51 -
 52
52 -
 53
53 -
 54
54 -
 55
55 -
56
-
57
-
58
-
59
-
60
-
61
-
62
-
63
-
64
-
65
-
66
-
67
-
68
-
69
-
70
-
71
-
72
-
73
-
74
-
75
-
76
-
77
-
78
-
79
-
80
-
81
-
82
-
83
-
84
-
85
-
86
-
87
-
88
-
89
-
90
-
91
-
92
-
93
-
94
-
95
-
96
-
97
-
98
-
99
-
100
-
101
-
102
-
103
-
104
-
105
-
106
-
107
-
108
-
109
-
110
-
111
-
112
-
113
-
114
-
115
-
116
-
117
-
118
-
119
-
120
-
121
-
122
-
123
-
124
-
125
-
126
-
127
-
128
-
129
-
130
-
131
-
132
-
133
-
134
-
135
-
136
-
137
-
138
-
139
-
140
-
141
-
142
-
143
-
144
-
145
-
146
-
147
-
148
-
149
-
150
-
151
-
152
-
153
-
154
-
155
-
156
-
157
-
158
-
159
-
160
-
161
-
162
-
163
-
164
-
165
-
166
-
167
-
168
-
169
-
170
-
171
-
172
-
173
-
174
-
175
-
176
-
177
-
178
-
179
-
180
-
181
-
182
-
183
-
184
-
185
-
186
-
187
-
188
-
189
-
190
-
191
-
192
-
193
-
194
-
195
-
196
-
197
 |
 |

44
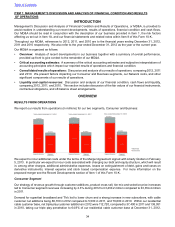
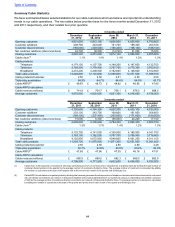
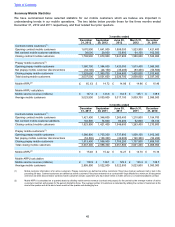
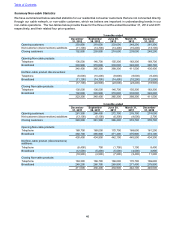
Summary Cable Statistics
We have summarized below selected statistics for our cable customers which we believe are important in understanding
trends in our cable operations. The two tables below provide these for the three months ended December 31, 2012
and 2011 respectively, and their related four prior quarters.
3 months ended
December
31, 2012 September
30, 2012 June 30,
2012 March 31,
2012 December
31, 2011
Opening customers 4,851,600 4,812,100 4,826,800 4,805,600 4,790,600
Customer additions 208,700 243,000 181,700 189,300 203,100
Customer disconnections (166,000) (203,500) (196,400) (168,100) (188,100)
Net customer additions (disconnections) 42,700 39,500 (14,700) 21,200 15,000
Closing customers 4,894,300 4,851,600 4,812,100 4,826,800 4,805,600
Cable churn(1) 1.1% 1.4% 1.4% 1.2% 1.3%
Cable products:
Telephone 4,179,100 4,157,700 4,148,300 4,147,600 4,132,700
Television 3,795,500 3,778,400 3,767,700 3,775,300 3,763,100
Broadband 4,272,200 4,209,500 4,152,600 4,148,600 4,102,900
Total cable products 12,246,800 12,145,600 12,068,600 12,071,500 11,998,700
Cable products/Customer 2.50 2.50 2.51 2.50 2.50
Triple-play penetration 64.9% 64.7% 64.6% 64.0% 63.7%
Cable ARPU(2) £ 48.87 £ 48.73 £ 48.82 £ 46.95 £ 47.85
Cable ARPU calculation:
Cable revenue (millions) £ 714.8 £ 704.7 £ 706.1 £ 678.3 £ 688.5
Average customers 4,875,900 4,820,600 4,821,100 4,816,600 4,796,900
3 months ended
December
31, 2011 September
30, 2011 June 30,
2011 March 31,
2011 December
31, 2010
Opening customers 4,790,600 4,784,300 4,820,300 4,800,100 4,783,000
Customer additions 203,100 243,700 169,800 191,800 206,600
Customer disconnections (188,100) (237,400) (205,800) (171,600) (189,500)
Net customer additions (disconnections) 15,000 6,300 (36,000) 20,200 17,100
Closing customers 4,805,600 4,790,600 4,784,300 4,820,300 4,800,100
Cable churn(1) 1.3% 1.7% 1.4% 1.2% 1.3%
Cable products:
Telephone 4,132,700 4,141,000 4,155,000 4,180,900 4,161,700
Television 3,763,100 3,762,000 3,767,700 3,788,900 3,778,800
Broadband 4,102,900 4,072,900 4,048,600 4,061,200 4,011,100
Total cable products 11,998,700 11,975,900 11,971,300 12,031,000 11,951,600
Cable products/Customer 2.50 2.50 2.50 2.50 2.49
Triple-play penetration 63.7% 63.8% 63.8% 63.4% 63.0%
Cable ARPU(2) £ 47.85 £ 47.86 £ 47.35 £ 46.16 £ 47.51
Cable ARPU calculation:
Cable revenue (millions) £ 688.5 £ 685.0 £ 682.3 £ 666.0 £ 682.8
Average customers 4,796,900 4,771,500 4,802,600 4,809,000 4,790,000
(1) Cable churn is the proportion of customers who stop subscribing to all of our services and is calculated on a quarterly basis by dividing the total number of
customer disconnections in the quarter by the average number of customers divided by three. The average number of customers is calculated by adding
the number of customers at the start of the quarter and at the end of each month of the quarter and dividing by four.
(2) Cable ARPU is calculated on a quarterly basis by dividing total revenue generated from the provision of telephone, television and internet services to customers
who are directly connected to our network in that period together with revenue generated from our customers using our virginmedia.com website, exclusive
of VAT, by the average number of customers directly connected to our network in that period divided by three. The average number of customers is calculated
by adding the number of customers at the start of the quarter and at the end of each month of the quarter and dividing by four.
Table of Contents