Virgin Media 2012 Annual Report Download - page 100
Download and view the complete annual report
Please find page 100 of the 2012 Virgin Media annual report below. You can navigate through the pages in the report by either clicking on the pages listed below, or by using the keyword search tool below to find specific information within the annual report.-
 1
1 -
2
-
3
-
4
-
5
-
6
-
7
-
8
-
9
-
10
-
11
-
12
-
13
-
14
-
15
-
16
-
17
-
18
-
19
-
20
-
21
-
22
-
23
-
24
-
25
-
26
-
27
-
28
-
29
-
30
-
31
-
32
-
33
-
34
-
35
-
36
-
37
-
38
-
39
-
40
-
41
-
42
-
43
-
44
-
45
-
46
-
47
-
48
-
49
-
50
-
51
-
52
-
53
-
54
-
55
-
56
-
57
-
58
-
59
-
60
-
61
-
62
-
63
-
64
-
65
-
66
-
67
-
68
-
69
-
70
-
71
-
72
-
73
-
74
-
75
-
76
-
77
-
78
-
79
-
80
-
81
-
82
-
83
-
84
-
85
-
86
-
87
-
88
-
89
-
 90
90 -
 91
91 -
 92
92 -
 93
93 -
 94
94 -
 95
95 -
 96
96 -
 97
97 -
 98
98 -
 99
99 -
 100
100 -
 101
101 -
 102
102 -
 103
103 -
 104
104 -
 105
105 -
 106
106 -
 107
107 -
 108
108 -
 109
109 -
 110
110 -
111
-
112
-
113
-
114
-
115
-
116
-
117
-
118
-
119
-
120
-
121
-
122
-
123
-
124
-
125
-
126
-
127
-
128
-
129
-
130
-
131
-
132
-
133
-
134
-
135
-
136
-
137
-
138
-
139
-
140
-
141
-
142
-
143
-
144
-
145
-
146
-
147
-
148
-
149
-
150
-
151
-
152
-
153
-
154
-
155
-
156
-
157
-
158
-
159
-
160
-
161
-
162
-
163
-
164
-
165
-
166
-
167
-
168
-
169
-
170
-
171
-
172
-
173
-
174
-
175
-
176
-
177
-
178
-
179
-
180
-
181
-
182
-
183
-
184
-
185
-
186
-
187
-
188
-
189
-
190
-
191
-
192
-
193
-
194
-
195
-
196
-
197
 |
 |

F-29
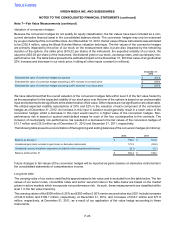
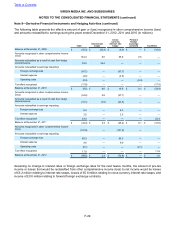
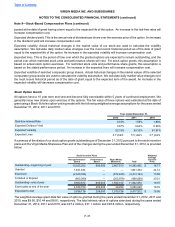
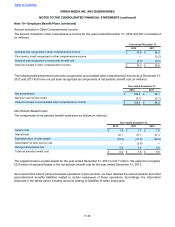
The following table presents the effective amount of gain or (loss) recognized in other comprehensive income (loss)
and amounts reclassified to earnings during the years ended December 31, 2012, 2011 and 2010 (in millions):
Total Interest rate
swaps
Cross-
currency
interest rate
swaps
Forward
foreign
exchange
contracts Tax Effect
Balance at December 31, 2009 £(55.3) £ (32.4) £ (6.9) £ — £ (16.0)
Amounts recognized in other comprehensive income
(loss) 104.3 8.0 95.8 0.5 —
Amounts reclassified as a result of cash flow hedge
discontinuance 32.4 32.4 ———
Amounts reclassified to earnings impacting:
Foreign exchange loss (67.7) — (67.7) — —
Interest expense (4.6) — (4.6) — —
Operating costs (0.4) — — (0.4) —
Tax effect recognized (17.9) — — — (17.9)
Balance at December 31, 2010 £(9.2) £ 8.0 £ 16.6 £ 0.1 £ (33.9)
Amounts recognized in other comprehensive income
(loss) (24.2) 2.9 (27.1) — —
Amounts reclassified as a result of cash flow hedge
discontinuance (31.1)(7.6)(23.5) — —
Amounts reclassified to earnings impacting:
Foreign exchange loss 6.3 — 6.3 — —
Interest expense 2.5 — 2.5 — —
Tax effect recognized 23.3 — — — 23.3
Balance at December 31, 2011 £(32.4) £ 3.3 £ (25.2) £ 0.1 £ (10.6)
Amounts recognized in other comprehensive income
(loss) (141.9) — (141.9) —
Amounts reclassified to earnings impacting:
Foreign exchange loss 85.3 — 85.3 — —
Interest expense 9.0 — 9.0 — —
Operating costs (0.1) — — (0.1) —
Tax effect recognized 11.6 — — — 11.6
Balance at December 31, 2012 £(68.5) £ 3.3 £ (72.8) £ — £ 1.0
Assuming no change in interest rates or foreign exchange rates for the next twelve months, the amount of pre-tax
income or losses that would be reclassified from other comprehensive income (loss) to net income would be losses
of £3.2 million relating to interest rate swaps, losses of £5.8 million relating to cross-currency interest rate swaps, and
income of £0.0 million relating to forward foreign exchange contracts.
Table of Contents
VIRGIN MEDIA INC. AND SUBSIDIARIES
NOTES TO THE CONSOLIDATED FINANCIAL STATEMENTS (continued)
Note 8—Derivative Financial Instruments and Hedging Activities (continued)