Virgin Media 2012 Annual Report Download - page 34
Download and view the complete annual report
Please find page 34 of the 2012 Virgin Media annual report below. You can navigate through the pages in the report by either clicking on the pages listed below, or by using the keyword search tool below to find specific information within the annual report.-
 1
1 -
2
-
3
-
4
-
5
-
6
-
7
-
8
-
9
-
10
-
11
-
12
-
13
-
14
-
15
-
16
-
17
-
18
-
19
-
20
-
21
-
22
-
23
-
 24
24 -
 25
25 -
 26
26 -
 27
27 -
 28
28 -
 29
29 -
 30
30 -
 31
31 -
 32
32 -
 33
33 -
 34
34 -
 35
35 -
 36
36 -
 37
37 -
 38
38 -
 39
39 -
 40
40 -
 41
41 -
 42
42 -
 43
43 -
 44
44 -
45
-
46
-
47
-
48
-
49
-
50
-
51
-
52
-
53
-
54
-
55
-
56
-
57
-
58
-
59
-
60
-
61
-
62
-
63
-
64
-
65
-
66
-
67
-
68
-
69
-
70
-
71
-
72
-
73
-
74
-
75
-
76
-
77
-
78
-
79
-
80
-
81
-
82
-
83
-
84
-
85
-
86
-
87
-
88
-
89
-
90
-
91
-
92
-
93
-
94
-
95
-
96
-
97
-
98
-
99
-
100
-
101
-
102
-
103
-
104
-
105
-
106
-
107
-
108
-
109
-
110
-
111
-
112
-
113
-
114
-
115
-
116
-
117
-
118
-
119
-
120
-
121
-
122
-
123
-
124
-
125
-
126
-
127
-
128
-
129
-
130
-
131
-
132
-
133
-
134
-
135
-
136
-
137
-
138
-
139
-
140
-
141
-
142
-
143
-
144
-
145
-
146
-
147
-
148
-
149
-
150
-
151
-
152
-
153
-
154
-
155
-
156
-
157
-
158
-
159
-
160
-
161
-
162
-
163
-
164
-
165
-
166
-
167
-
168
-
169
-
170
-
171
-
172
-
173
-
174
-
175
-
176
-
177
-
178
-
179
-
180
-
181
-
182
-
183
-
184
-
185
-
186
-
187
-
188
-
189
-
190
-
191
-
192
-
193
-
194
-
195
-
196
-
197
 |
 |

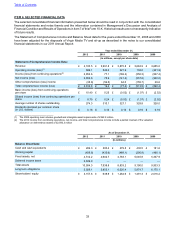
33
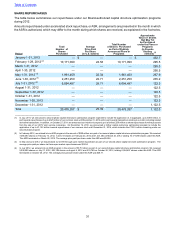
ITEM 6. SELECTED FINANCIAL DATA
The selected consolidated financial information presented below should be read in conjunction with the consolidated
financial statements and notes thereto and the information contained in Management’s Discussion and Analysis of
Financial Condition and Results of Operations in Item 7 of this Form 10-K. Historical results are not necessarily indicative
of future results.
The Statement of Comprehensive Income and Balance Sheet data for the years ended December 31, 2008 and 2009
have been adjusted for the disposals of Virgin Media TV and sit-up as described in the notes to our consolidated
financial statements in our 2011 Annual Report.
Year ended December 31,
2012 2011 2010 2009 2008
(in millions, except per share data)
Statement of Comprehensive Income Data:
Revenue £ 4,100.5 £ 3,991.8 £ 3,875.8 £ 3,663.9 £ 3,655.0
Operating income (loss)(1) 699.1 540.2 321.9 132.0 (261.9)
Income (loss) from continuing operations(2) 2,852.6 77.1 (169.2) (350.3) (827.4)
Net income (loss) 2,852.6 75.9 (141.4) (357.8) (920.0)
Other comprehensive (loss) income (35.8) (56.5) 64.0 (155.7) 29.6
Total comprehensive income (loss) £ 2,816.8 £ 19.4 £ (77.4) £ (513.5) £ (890.4)
Basic income (loss) from continuing operations
per share £ 10.40 £ 0.25 £ (0.52) £ (1.07) £ (2.52)
Diluted income (loss) from continuing operations per
share £ 8.75 £ 0.24 £ (0.52) £ (1.07) £ (2.52)
Average number of shares outstanding 274.3 310.1 327.1 328.8 328.0
Dividends declared per common share
(in U.S. dollars) $ 0.16 $ 0.16 $ 0.16 $ 0.16 $ 0.16
______________________________
(1) The 2008 operating loss includes goodwill and intangible asset impairments of £362.2 million.
(2) The 2012 income from continuing operations, net income, and total comprehensive income include a partial reversal of the valuation
allowance on deferred tax assets of £2,592.3 million
As of December 31,
2012 2011 2010 2009 2008
(in millions)
Balance Sheet Data:
Cash and cash equivalents £ 206.3 £ 300.4 £ 479.5 £ 430.5 £ 181.6
Working capital (409.8) (433.6) (468.1) (290.9) (460.1)
Fixed assets, net 4,512.2 4,602.7 4,763.1 5,045.8 5,337.9
Deferred income taxes 2,639.0 — — — —
Total assets 10,504.3 7,938.8 8,833.2 9,190.0 9,933.3
Long term obligations 5,929.1 5,855.1 6,020.4 5,974.7 6,170.1
Shareholders’ equity £ 3,157.6 £ 638.9 £ 1,264.6 £ 1,491.3 £ 2,016.2
Table of Contents