Virgin Media 2012 Annual Report Download - page 49
Download and view the complete annual report
Please find page 49 of the 2012 Virgin Media annual report below. You can navigate through the pages in the report by either clicking on the pages listed below, or by using the keyword search tool below to find specific information within the annual report.-
 1
1 -
2
-
3
-
4
-
5
-
6
-
7
-
8
-
9
-
10
-
11
-
12
-
13
-
14
-
15
-
16
-
17
-
18
-
19
-
20
-
21
-
22
-
23
-
24
-
25
-
26
-
27
-
28
-
29
-
30
-
31
-
32
-
33
-
34
-
35
-
36
-
37
-
38
-
 39
39 -
 40
40 -
 41
41 -
 42
42 -
 43
43 -
 44
44 -
 45
45 -
 46
46 -
 47
47 -
 48
48 -
 49
49 -
 50
50 -
 51
51 -
 52
52 -
 53
53 -
 54
54 -
 55
55 -
 56
56 -
 57
57 -
 58
58 -
 59
59 -
60
-
61
-
62
-
63
-
64
-
65
-
66
-
67
-
68
-
69
-
70
-
71
-
72
-
73
-
74
-
75
-
76
-
77
-
78
-
79
-
80
-
81
-
82
-
83
-
84
-
85
-
86
-
87
-
88
-
89
-
90
-
91
-
92
-
93
-
94
-
95
-
96
-
97
-
98
-
99
-
100
-
101
-
102
-
103
-
104
-
105
-
106
-
107
-
108
-
109
-
110
-
111
-
112
-
113
-
114
-
115
-
116
-
117
-
118
-
119
-
120
-
121
-
122
-
123
-
124
-
125
-
126
-
127
-
128
-
129
-
130
-
131
-
132
-
133
-
134
-
135
-
136
-
137
-
138
-
139
-
140
-
141
-
142
-
143
-
144
-
145
-
146
-
147
-
148
-
149
-
150
-
151
-
152
-
153
-
154
-
155
-
156
-
157
-
158
-
159
-
160
-
161
-
162
-
163
-
164
-
165
-
166
-
167
-
168
-
169
-
170
-
171
-
172
-
173
-
174
-
175
-
176
-
177
-
178
-
179
-
180
-
181
-
182
-
183
-
184
-
185
-
186
-
187
-
188
-
189
-
190
-
191
-
192
-
193
-
194
-
195
-
196
-
197
 |
 |

48
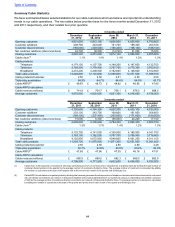
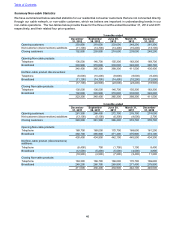
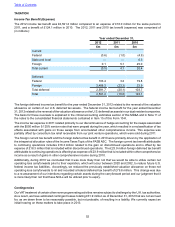
Retail revenues
During 2012 we have continued our strategy of focusing on higher margin data revenue and increasing demand for
our data products within a growing data market. The retail business within our Business segment provides a portfolio
of solutions to large, medium and small enterprises and the public sector, seeing particular success during 2012 with
new revenues from a major public sector contract won in 2011 together with an increase in retail volumes across key
IPVPN and Ethernet products.
As a result retail data revenues rose by 10.9% to £307.2 million in 2012 from £277.0 million in 2011. In 2011 data
revenues increased by 14.7% from £241.5 million in 2010. Retail data revenue represented 64.0% of the retail business
revenue for 2012, compared with 59.4% for 2011, and 55.3% for 2010.
Retail voice revenues continued to decline during 2012, consistent with the trend across the industry, and our consumer
segment, as customers migrated from using fixed line telephony to other forms such as mobile telephony and internet
based solutions, including video calling. The decline in retail voice revenues in 2012 of 9.5% to £139.1m was principally
as a result of this trend. Retail voice revenue decreased by 5.9% in 2011 compared to 2010, mainly as a result of
declining telephony usage and, to a lesser extent, a decline in rental and install revenues.
Our LAN Solutions business saw a decrease in revenue to £33.9 million in 2012 due to a varying level of activity within
these infrastructure projects which are by nature non-recurring. In 2011 revenue was £35.4 million compared to
£31.7 million for 2010, with growth being primarily from equipment and LAN project revenues.
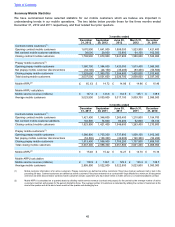
Wholesale revenues
During 2012, we continued to work with our partner markets to provide core networks and vital access services,
securing an increase in mobile backhaul revenues and increased demand for our key data products.
Reflecting the trend of increased data demand, our wholesale data revenues for 2012 of £167.6 million increased by
9.5% compared to £153.1 million in 2011. As noted above, the nature of our relationships with business customers
is that significant contracts, where we may earn revenues unevenly, can impact the year-on-year movement as we
continue our long term growth trend. The 11.2% increase observed during 2011 from 2010 revenues of £137.7 million
was primarily as a a result of increased usage of our network by wholesale data customers.
Wholesale voice revenues increased by 23.6% to £22.5 million in 2012 from £18.2 million in 2011 as we secured traffic
from operators that had been migrated to other providers in the second half of 2011.
Business Segment Contribution
During 2012, Business segment contribution increased by 0.9% to £380.8 million from £377.4 million in 2011. In 2011
Business segment contribution increased by 10.1% from £342.8 million for 2010.
The principal components of operating costs and selling, general, and administrative expenses within our Business
segment include:
• interconnect and circuit costs paid to other telecommunication carriers;
• payroll and other employee related costs;
• marketing and selling costs.
Further discussion of the annual movement in these costs is provided in the operating expenses section of this MD&A.
Whilst increased revenues have been the principal driver of the increase in Business segment contribution during
2012, these have been offset by higher acquisition and delivery costs during the early life of certain significant contracts.
The increase in 2011 Business segment contribution was primarily due to higher revenue.
Table of Contents