Virgin Media 2012 Annual Report Download - page 61
Download and view the complete annual report
Please find page 61 of the 2012 Virgin Media annual report below. You can navigate through the pages in the report by either clicking on the pages listed below, or by using the keyword search tool below to find specific information within the annual report.-
 1
1 -
2
-
3
-
4
-
5
-
6
-
7
-
8
-
9
-
10
-
11
-
12
-
13
-
14
-
15
-
16
-
17
-
18
-
19
-
20
-
21
-
22
-
23
-
24
-
25
-
26
-
27
-
28
-
29
-
30
-
31
-
32
-
33
-
34
-
35
-
36
-
37
-
38
-
39
-
40
-
41
-
42
-
43
-
44
-
45
-
46
-
47
-
48
-
49
-
50
-
 51
51 -
 52
52 -
 53
53 -
 54
54 -
 55
55 -
 56
56 -
 57
57 -
 58
58 -
 59
59 -
 60
60 -
 61
61 -
 62
62 -
 63
63 -
 64
64 -
 65
65 -
 66
66 -
 67
67 -
 68
68 -
 69
69 -
 70
70 -
 71
71 -
72
-
73
-
74
-
75
-
76
-
77
-
78
-
79
-
80
-
81
-
82
-
83
-
84
-
85
-
86
-
87
-
88
-
89
-
90
-
91
-
92
-
93
-
94
-
95
-
96
-
97
-
98
-
99
-
100
-
101
-
102
-
103
-
104
-
105
-
106
-
107
-
108
-
109
-
110
-
111
-
112
-
113
-
114
-
115
-
116
-
117
-
118
-
119
-
120
-
121
-
122
-
123
-
124
-
125
-
126
-
127
-
128
-
129
-
130
-
131
-
132
-
133
-
134
-
135
-
136
-
137
-
138
-
139
-
140
-
141
-
142
-
143
-
144
-
145
-
146
-
147
-
148
-
149
-
150
-
151
-
152
-
153
-
154
-
155
-
156
-
157
-
158
-
159
-
160
-
161
-
162
-
163
-
164
-
165
-
166
-
167
-
168
-
169
-
170
-
171
-
172
-
173
-
174
-
175
-
176
-
177
-
178
-
179
-
180
-
181
-
182
-
183
-
184
-
185
-
186
-
187
-
188
-
189
-
190
-
191
-
192
-
193
-
194
-
195
-
196
-
197
 |
 |
60
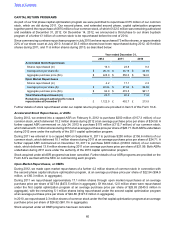
CAPITAL RETURN PROGRAMS
As part of our first phase capital optimization program we were permitted to repurchase £375 million of our common
stock, which we did during 2011. Our second phase, and extended second phase, capital optimization programs
together permit the repurchase of £875 million of our common stock, of which £122.5 million was remaining authorized
and available at December 31, 2012. On December 14, 2012, we announced a third phase to our share buyback
program of a further £1 billion of common stock to be repurchased before the end of 2014.
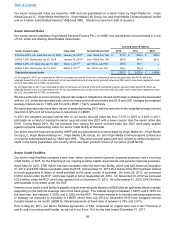
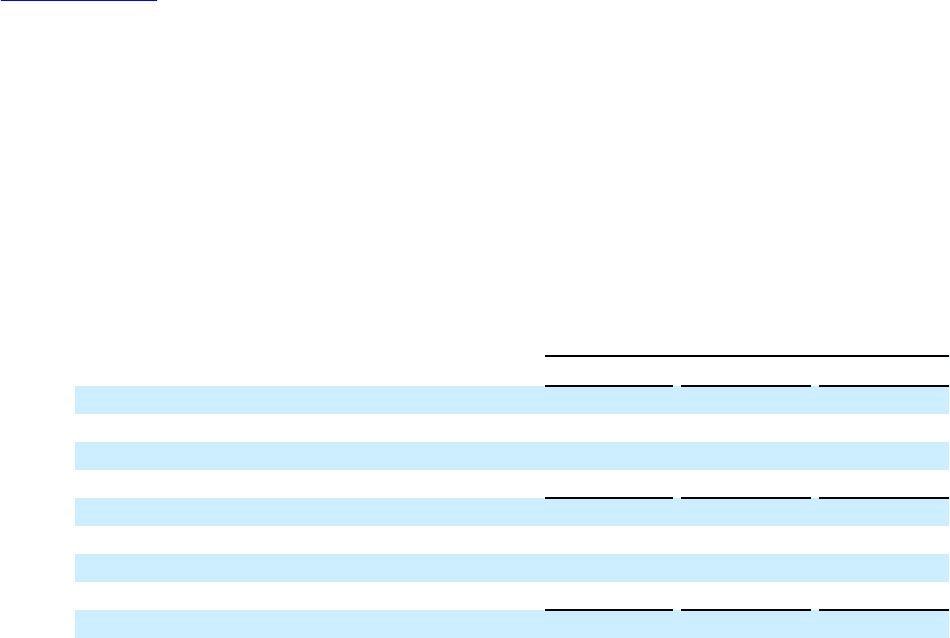
Since commencing our share repurchase program in July 2010 we have repurchased 73 million shares, or approximately
22% of our share count at July 2010. A total of 20.5 million shares have been repurchased during 2012, 40.9 million
shares during 2011, and 11.6 million shares during 2010, as described below:
Year ended December 31,
2012 2011 2010
Accelerated Stock Repurchases
Shares repurchased (m) 16.3 23.8 9.3
Average price per share ($) $ 26.13 $ 23.15 $ 20.78
Aggregate purchase price ($m) $ 425.0 $ 550.0 $ 194.0
Open Market Repurchases
Shares repurchased (m) 4.2 17.1 2.3
Average price per share ($) $ 22.54 $ 27.64 $ 26.82
Aggregate purchase price ($m) $ 94.9 $ 472.5 $61.7
Total Shares Repurchased (m) 20.5 40.9 11.6
Remaining amount authorized for stock
repurchases at December 31 £ 1,122.5 £ 452.7 £ 213.5
Further details of stock repurchased under our capital returns programs are provided in Item 5 of this Form 10-K.
Accelerated Stock Repurchases, or ASRs
During 2012, we entered into a capped ASR on February 8, 2012 to purchase $250 million (£157.3 million) of our
common stock, which delivered 10.2 million shares during 2012 at an average purchase price per share of $24.58. A
further capped ASR commenced on July 24, 2012 to purchase $175 million (£112.7 million) of our common stock,
which delivered 6.1 million shares during 2012 at an average purchase price per share of $28.71. Both ASRs undertaken
during 2012 were under the authority of the 2011 capital optimization program.
During 2011 we entered in to a capped ASR on September 8, 2011 to purchase $250 million (£156.6 million) of our
common stock, which delivered 10.1 million shares during 2011 at an average purchase price per share of $24.71. A
further capped ASR commenced on November 10, 2011 to purchase $300 million (£188.0 million) of our common
stock, which delivered 13.6 million shares during 2011 at an average purchase price per share of $21.99. Both ASRs
undertaken during 2011 were under the authority of the 2010 capital optimization program.
Stock acquired under all ASR programs has been cancelled. Further details of our ASR programs are provided on the
Form 8-K's we filed with the SEC on commencing each program.
Open Market Repurchases, or OMRs
During 2012, we made open market repurchases of a further 4.2 million shares of common stock in connection with
the second phase capital structure optimization program, at an average purchase price per share of $22.54 ($94.9
million, or £60.3 million, in aggregate).
During 2011 we repurchased approximately 17.1 million shares through open market repurchases at an average
purchase price per share of $27.64 ($472.5 million in aggregate). Of this total, 12.0 million share were repurchased
under the first capital optimization program at an average purchase price per share of $28.83 ($345.5 million in
aggregate), with the remaining 5.1 million shares being repurchased under the second capital optimization program
at an average purchase price per share of $24.86 ($127.0 million in aggregate).
In 2010, we repurchased 2.3 million shares of common stock under the first capital optimization program at an average
purchase price per share of $26.82 ($61.7m in aggregate).
Stock acquired under all OMR programs has been cancelled.
Table of Contents