Virgin Media 2012 Annual Report Download - page 103
Download and view the complete annual report
Please find page 103 of the 2012 Virgin Media annual report below. You can navigate through the pages in the report by either clicking on the pages listed below, or by using the keyword search tool below to find specific information within the annual report.-
 1
1 -
2
-
3
-
4
-
5
-
6
-
7
-
8
-
9
-
10
-
11
-
12
-
13
-
14
-
15
-
16
-
17
-
18
-
19
-
20
-
21
-
22
-
23
-
24
-
25
-
26
-
27
-
28
-
29
-
30
-
31
-
32
-
33
-
34
-
35
-
36
-
37
-
38
-
39
-
40
-
41
-
42
-
43
-
44
-
45
-
46
-
47
-
48
-
49
-
50
-
51
-
52
-
53
-
54
-
55
-
56
-
57
-
58
-
59
-
60
-
61
-
62
-
63
-
64
-
65
-
66
-
67
-
68
-
69
-
70
-
71
-
72
-
73
-
74
-
75
-
76
-
77
-
78
-
79
-
80
-
81
-
82
-
83
-
84
-
85
-
86
-
87
-
88
-
89
-
90
-
91
-
92
-
 93
93 -
 94
94 -
 95
95 -
 96
96 -
 97
97 -
 98
98 -
 99
99 -
 100
100 -
 101
101 -
 102
102 -
 103
103 -
 104
104 -
 105
105 -
 106
106 -
 107
107 -
 108
108 -
 109
109 -
 110
110 -
 111
111 -
 112
112 -
 113
113 -
114
-
115
-
116
-
117
-
118
-
119
-
120
-
121
-
122
-
123
-
124
-
125
-
126
-
127
-
128
-
129
-
130
-
131
-
132
-
133
-
134
-
135
-
136
-
137
-
138
-
139
-
140
-
141
-
142
-
143
-
144
-
145
-
146
-
147
-
148
-
149
-
150
-
151
-
152
-
153
-
154
-
155
-
156
-
157
-
158
-
159
-
160
-
161
-
162
-
163
-
164
-
165
-
166
-
167
-
168
-
169
-
170
-
171
-
172
-
173
-
174
-
175
-
176
-
177
-
178
-
179
-
180
-
181
-
182
-
183
-
184
-
185
-
186
-
187
-
188
-
189
-
190
-
191
-
192
-
193
-
194
-
195
-
196
-
197
 |
 |

F-32
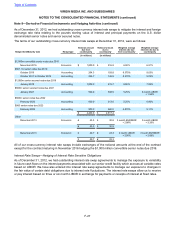
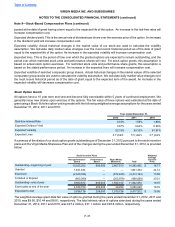
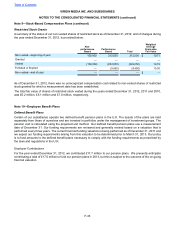
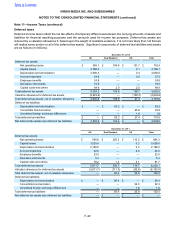
For performance based option grants, the performance objectives are set by the Compensation Committee of the
Board of Directors based upon quantitative and qualitative objectives, including earnings and stock price performance,
amongst others. These objectives may be absolute or relative to prior performance or to the performance of other
entities, indices or benchmarks and may be expressed in terms of progression within a specific range.
The aggregate intrinsic value of options outstanding as at December 31, 2012 was £131.7 million with a weighted
average remaining contractual term of 6.8 years. The aggregate intrinsic value of options exercisable as at
December 31, 2012 was £56.1 million with a weighted average remaining contractual term of 5.4 years. The aggregate
intrinsic value of options expected to vest as at December 31, 2012 was £62.4 million with a weighted average remaining
contractual term of 7.7 years.
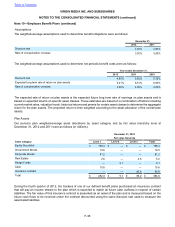
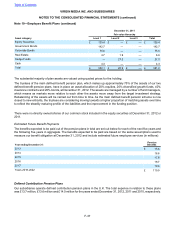
Restricted Stock Unit and Performance Share Grants
Participants in the our long term incentive plans are awarded restricted stock units or performance shares which vest
after a three year period dependent on the achievement of certain long term performance targets and continued
employment. The final number of awards vesting will be settled, at the Compensation Committee’s discretion, in either
common stock or an amount of cash equivalent to the fair market value at the date of vesting.
In 2010, the Compensation Committee introduced a relative stock performance measure to our stock incentive plan.
The vesting of a proportion of restricted stock units under the 2010-2012, 2011-2013 and 2012-2014 long term incentive
plans are subject to a relative Total Shareholder Value (“TSV”) performance measure. The measure is based on a
comparison of our stock price growth with that of a comparator group of organizations selected by the Compensation
Committee. The fair value of our restricted stock units containing a market condition, granted under our 2010-2012,
2011-2013 and 2012-2014 long term incentive plans was estimated at the date of grant using the Monte Carlo simulation
model.
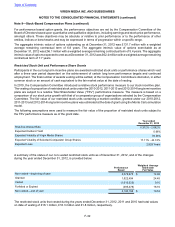
The following assumptions were used to measure the fair value of the proportion of restricted stock units subject to
the TSV performance measure as of the grant date.
Year ended
December 31, 2012
Risk-free Interest Rate 0.312% - 2.082%
Expected Dividend Yield 0.66%
Expected Volatility of Virgin Media Shares 39.36%
Expected Volatility of Selected Comparator Group Shares 17.11% - 44.74%
Expected Lives 2.929 Years
A summary of the status of our non-vested restricted stock units as of December 31, 2012, and of the changes
during the year ended December 31, 2012, is provided below:
Performance
Based
Weighted Average
Grant-date
Fair Value
Non-vested—beginning of year 4,078,675 $ 14.96
Granted 1,522,494 24.45
Vested (1,015,523) 9.10
Forfeited or Expired (395,478) 18.16
Non-vested—end of year 4,190,168 $ 19.53
The restricted stock units that vested during the years ended December 31, 2012, 2011 and 2010 had total values
on date of vesting of £16.1 million, £16.3 million and £1.8 million, respectively.
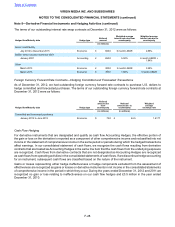
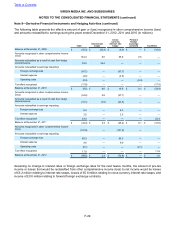
Table of Contents
VIRGIN MEDIA INC. AND SUBSIDIARIES
NOTES TO THE CONSOLIDATED FINANCIAL STATEMENTS (continued)
Note 9—Stock-Based Compensation Plans (continued)