Virgin Media 2012 Annual Report Download - page 183
Download and view the complete annual report
Please find page 183 of the 2012 Virgin Media annual report below. You can navigate through the pages in the report by either clicking on the pages listed below, or by using the keyword search tool below to find specific information within the annual report.-
 1
1 -
2
-
3
-
4
-
5
-
6
-
7
-
8
-
9
-
10
-
11
-
12
-
13
-
14
-
15
-
16
-
17
-
18
-
19
-
20
-
21
-
22
-
23
-
24
-
25
-
26
-
27
-
28
-
29
-
30
-
31
-
32
-
33
-
34
-
35
-
36
-
37
-
38
-
39
-
40
-
41
-
42
-
43
-
44
-
45
-
46
-
47
-
48
-
49
-
50
-
51
-
52
-
53
-
54
-
55
-
56
-
57
-
58
-
59
-
60
-
61
-
62
-
63
-
64
-
65
-
66
-
67
-
68
-
69
-
70
-
71
-
72
-
73
-
74
-
75
-
76
-
77
-
78
-
79
-
80
-
81
-
82
-
83
-
84
-
85
-
86
-
87
-
88
-
89
-
90
-
91
-
92
-
93
-
94
-
95
-
96
-
97
-
98
-
99
-
100
-
101
-
102
-
103
-
104
-
105
-
106
-
107
-
108
-
109
-
110
-
111
-
112
-
113
-
114
-
115
-
116
-
117
-
118
-
119
-
120
-
121
-
122
-
123
-
124
-
125
-
126
-
127
-
128
-
129
-
130
-
131
-
132
-
133
-
134
-
135
-
136
-
137
-
138
-
139
-
140
-
141
-
142
-
143
-
144
-
145
-
146
-
147
-
148
-
149
-
150
-
151
-
152
-
153
-
154
-
155
-
156
-
157
-
158
-
159
-
160
-
161
-
162
-
163
-
164
-
165
-
166
-
167
-
168
-
169
-
170
-
171
-
172
-
 173
173 -
 174
174 -
 175
175 -
 176
176 -
 177
177 -
 178
178 -
 179
179 -
 180
180 -
 181
181 -
 182
182 -
 183
183 -
 184
184 -
 185
185 -
 186
186 -
 187
187 -
 188
188 -
 189
189 -
 190
190 -
 191
191 -
 192
192 -
 193
193 -
194
-
195
-
196
-
197
 |
 |

F-112
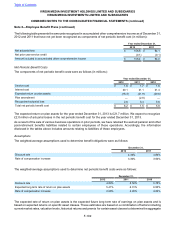
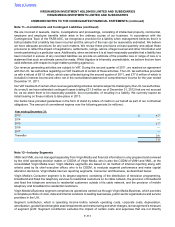
attributable to the reporting segments, such as the costs of operating the network, corporate costs and depreciation
and amortization. Restructuring and other charges, and goodwill and intangible asset impairments are excluded from
segment contribution as management believes they are not characteristic of our underlying business operations. Assets
are reviewed on a consolidated basis and are not allocated to segments for management reporting since the primary
asset of the business is the cable network infrastructure, which is shared by Virgin Media’s Consumer and Business
segments.
Segment information for the years ended December 31, 2012, 2011 and 2010 was as follows (in millions):
Revenue Segment
Contribution
Year ended December 31, 2012
Consumer £3,430.2 £2,053.2
Business 670.3 380.8
Subtotal 4,100.5 2,434.0
Companies not consolidated in VMIH and VMIL (119.8)
Total £3,980.7
Year ended December 31, 2011
Consumer £3,354.4 £1,991.5
Business 637.4 377.4
Subtotal 3,991.8 2,368.9
Companies not consolidated in VMIH and VMIL (102.0)
Total £3,889.8
Year ended December 31, 2010
Consumer £3,279.0 £1,982.4
Business 596.8 342.8
Subtotal 3,875.8 2,325.2
Companies not consolidated in VMIH and VMIL (102.1)
Total £3,773.7
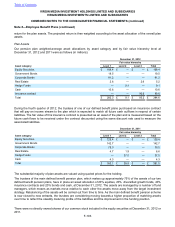
The reconciliation of total segment contribution to our consolidated operating income and net income (loss) is as
follows (in millions):
Year ended December 31,
2012 2011 2010
Total segment contribution £ 2,434.0 £ 2,368.9 £ 2,325.2
Other operating and corporate costs 780.5 778.7 815.0
Restructuring and other charges 2.7 8.4 53.0
Depreciation 951.7 923.2 987.7
Amortization — 118.4 147.6
Operating loss of subsidiaries not consolidated in either of the companies 0.5 (0.3)(6.3)
Consolidated operating income 698.6 540.5 328.2
Other income (expense)
Interest expense(1) (373.0) (401.7)(475.5)
Loss on extinguishment of debt — (28.9)(70.0)
Share of income from equity investments — 18.6 24.0
Loss on disposal of equity investments — (7.2)—
Loss on derivative instruments (26.1)(7.4)(48.2)
Foreign currency (losses) gains (28.9) 1.7 (32.6)
Interest income and other, net(2) 67.3 88.9 16.9
Income tax benefit (expense) 2,531.1 (15.6)127.9
Income (loss) from continuing operations 2,869.0 188.9 (129.3)
(Loss) income from discontinued operations, net of tax — (1.2)27.8
Net income (loss) £ 2,869.0 £ 187.7 £(101.5)
Table of Contents
VIRGIN MEDIA INVESTMENT HOLDINGS LIMITED AND SUBSIDIARIES
VIRGIN MEDIA INVESTMENTS LIMITED AND SUBSIDIARIES
COMBINED NOTED TO THE CONSOLIDATED FINANCIAL STATEMENTS (continued)
Note 12—Industry Segments (continued)