Virgin Media 2012 Annual Report Download - page 54
Download and view the complete annual report
Please find page 54 of the 2012 Virgin Media annual report below. You can navigate through the pages in the report by either clicking on the pages listed below, or by using the keyword search tool below to find specific information within the annual report.-
 1
1 -
2
-
3
-
4
-
5
-
6
-
7
-
8
-
9
-
10
-
11
-
12
-
13
-
14
-
15
-
16
-
17
-
18
-
19
-
20
-
21
-
22
-
23
-
24
-
25
-
26
-
27
-
28
-
29
-
30
-
31
-
32
-
33
-
34
-
35
-
36
-
37
-
38
-
39
-
40
-
41
-
42
-
43
-
 44
44 -
 45
45 -
 46
46 -
 47
47 -
 48
48 -
 49
49 -
 50
50 -
 51
51 -
 52
52 -
 53
53 -
 54
54 -
 55
55 -
 56
56 -
 57
57 -
 58
58 -
 59
59 -
 60
60 -
 61
61 -
 62
62 -
 63
63 -
 64
64 -
65
-
66
-
67
-
68
-
69
-
70
-
71
-
72
-
73
-
74
-
75
-
76
-
77
-
78
-
79
-
80
-
81
-
82
-
83
-
84
-
85
-
86
-
87
-
88
-
89
-
90
-
91
-
92
-
93
-
94
-
95
-
96
-
97
-
98
-
99
-
100
-
101
-
102
-
103
-
104
-
105
-
106
-
107
-
108
-
109
-
110
-
111
-
112
-
113
-
114
-
115
-
116
-
117
-
118
-
119
-
120
-
121
-
122
-
123
-
124
-
125
-
126
-
127
-
128
-
129
-
130
-
131
-
132
-
133
-
134
-
135
-
136
-
137
-
138
-
139
-
140
-
141
-
142
-
143
-
144
-
145
-
146
-
147
-
148
-
149
-
150
-
151
-
152
-
153
-
154
-
155
-
156
-
157
-
158
-
159
-
160
-
161
-
162
-
163
-
164
-
165
-
166
-
167
-
168
-
169
-
170
-
171
-
172
-
173
-
174
-
175
-
176
-
177
-
178
-
179
-
180
-
181
-
182
-
183
-
184
-
185
-
186
-
187
-
188
-
189
-
190
-
191
-
192
-
193
-
194
-
195
-
196
-
197
 |
 |

53
OTHER INCOME AND EXPENSES (EFFECT OF OPERATIONS DISCONTINUED IN PRIOR YEARS)
Gain on Disposal
In 2010 we reported a gain on disposal of £19.2 million, net of tax of £15 million, relating the sale of our Virgin Media
TV business. We had no such disposals during either 2011 or 2012.
(Loss) Income on Discontinued Operations
We had no discontinued operations during 2012.
In 2011 the loss on discontinued operations was £1.2 million compared with an income of £27.8 million for 2010 and
represents the results of our former Virgin Media TV business sold in 2010, including the gain on disposal. Further
details are provided in our 2011 Annual Report on Form 10-K filed with the SEC.
EARNINGS PER SHARE AND DIVIDENDS
Earnings per share
Income (Loss) from Continuing Operations
During 2012, net income from continuing operations was £2,852.6 million, compared with net income from continuing
operations of £77.1 million for 2011 due to the factors discussed above.
In 2011, the net income from continuing operations was £77.1 million, compared with a loss of £169.2 million from
continuing operations for 2010 due to the factors discussed above.
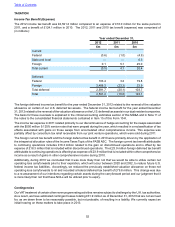
Basic Income (Loss) from Continuing Operations Per Share
Basic income from continuing operations per common share for 2012 was £10.40 compared to a basic loss per share
of £0.25 for 2011. Basic income (loss) per share is computed using a weighted average of 274.3 million shares issued
and outstanding in the year ended December 31, 2012 and a weighted average of 310.1 million shares issued and
outstanding for the same period in 2011.
Basic income from continuing operations per common share for 2011 was £0.25 compared to a basic loss per share
of £0.52 for 2010. Basic income (loss) per share is computed using a weighted average of 310.1 million shares issued
and outstanding in the year ended December 31, 2011 and a weighted average of 327.1 million shares issued and
outstanding for the same period in 2010.
Dividends
Details of dividend payments are provided in Item 5 of this Form 10-K, Market for Registrant's Common Equity, Related
Stockholder Matters and Issuer Purchases of Equity Securities.
Table of Contents