Virgin Media 2012 Annual Report Download - page 123
Download and view the complete annual report
Please find page 123 of the 2012 Virgin Media annual report below. You can navigate through the pages in the report by either clicking on the pages listed below, or by using the keyword search tool below to find specific information within the annual report.-
 1
1 -
2
-
3
-
4
-
5
-
6
-
7
-
8
-
9
-
10
-
11
-
12
-
13
-
14
-
15
-
16
-
17
-
18
-
19
-
20
-
21
-
22
-
23
-
24
-
25
-
26
-
27
-
28
-
29
-
30
-
31
-
32
-
33
-
34
-
35
-
36
-
37
-
38
-
39
-
40
-
41
-
42
-
43
-
44
-
45
-
46
-
47
-
48
-
49
-
50
-
51
-
52
-
53
-
54
-
55
-
56
-
57
-
58
-
59
-
60
-
61
-
62
-
63
-
64
-
65
-
66
-
67
-
68
-
69
-
70
-
71
-
72
-
73
-
74
-
75
-
76
-
77
-
78
-
79
-
80
-
81
-
82
-
83
-
84
-
85
-
86
-
87
-
88
-
89
-
90
-
91
-
92
-
93
-
94
-
95
-
96
-
97
-
98
-
99
-
100
-
101
-
102
-
103
-
104
-
105
-
106
-
107
-
108
-
109
-
110
-
111
-
112
-
 113
113 -
 114
114 -
 115
115 -
 116
116 -
 117
117 -
 118
118 -
 119
119 -
 120
120 -
 121
121 -
 122
122 -
 123
123 -
 124
124 -
 125
125 -
 126
126 -
 127
127 -
 128
128 -
 129
129 -
 130
130 -
 131
131 -
 132
132 -
 133
133 -
134
-
135
-
136
-
137
-
138
-
139
-
140
-
141
-
142
-
143
-
144
-
145
-
146
-
147
-
148
-
149
-
150
-
151
-
152
-
153
-
154
-
155
-
156
-
157
-
158
-
159
-
160
-
161
-
162
-
163
-
164
-
165
-
166
-
167
-
168
-
169
-
170
-
171
-
172
-
173
-
174
-
175
-
176
-
177
-
178
-
179
-
180
-
181
-
182
-
183
-
184
-
185
-
186
-
187
-
188
-
189
-
190
-
191
-
192
-
193
-
194
-
195
-
196
-
197
 |
 |

F-52
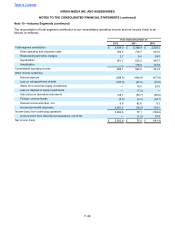
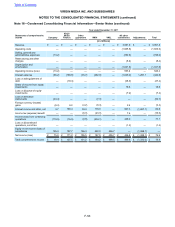
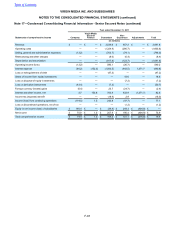
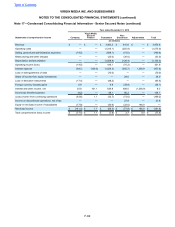
Year ended December 31, 2012
Statements of comprehensive
income Company
Virgin
Media
Finance Other
guarantors VMIH VMIL All other
subsidiaries Adjustments Total
(in millions)
Revenue £ — £ — £ — £ — £ — £ 4,100.5 £ — £ 4,100.5
Operating costs — — — — — (1,629.2) — (1,629.2)
Selling, general and
administrative expenses (15.3) — — — — (802.5) — (817.8)
Restructuring and other
charges — — — — — (2.7) — (2.7)
Depreciation and
amortization — — — — — (951.7) — (951.7)
Operating income (loss) (15.3) — — — — 714.4 —699.1
Interest expense (112.4) (155.2) (10.9) (344.4) — (939.2) 1,163.6 (398.5)
Loss on extinguishment of
debt — (187.8) — — — — — (187.8)
Gain (loss) on derivative
instruments 174.2 — — (26.1) — — — 148.1
Foreign currency losses (0.1) (7.8)(2.8)(24.5) — (4.5)33.4 (6.3)
Interest income and other, net — 167.2 15.5 186.2 —801.5 (1,163.6) 6.8
Income tax benefit (expense) — — 0.1 (0.6) — 2,591.7 — 2,591.2
Income (loss) from continuing
operations 46.4 (183.6) 1.9 (209.4) — 3,163.9 33.4 2,852.6
Equity in net income (loss) of
subsidiaries 2,806.2 2,902.4 2,804.2 3,078.4 3,076.4 — (14,667.6) —
Net income £ 2,852.6 £ 2,718.8 £ 2,806.1 £ 2,869.0 £ 3,076.4 £ 3,163.9 £ (14,634.2) £ 2,852.6
Total comprehensive income £ 2,816.8 £ 2,671.7 £ 2,761.2 £ 2,821.8 £ 3,077.0 £ 3,164.5 £ (14,496.2) £ 2,816.8
Table of Contents
VIRGIN MEDIA INC. AND SUBSIDIARIES
NOTES TO THE CONSOLIDATED FINANCIAL STATEMENTS (continued)
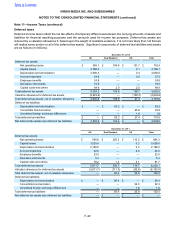
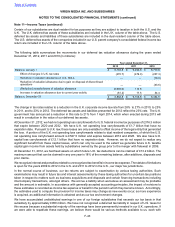
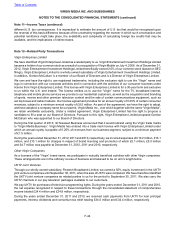
Note 16—Condensed Consolidating Financial Information—Senior Notes (continued)