Virgin Media 2012 Annual Report Download - page 106
Download and view the complete annual report
Please find page 106 of the 2012 Virgin Media annual report below. You can navigate through the pages in the report by either clicking on the pages listed below, or by using the keyword search tool below to find specific information within the annual report.-
 1
1 -
2
-
3
-
4
-
5
-
6
-
7
-
8
-
9
-
10
-
11
-
12
-
13
-
14
-
15
-
16
-
17
-
18
-
19
-
20
-
21
-
22
-
23
-
24
-
25
-
26
-
27
-
28
-
29
-
30
-
31
-
32
-
33
-
34
-
35
-
36
-
37
-
38
-
39
-
40
-
41
-
42
-
43
-
44
-
45
-
46
-
47
-
48
-
49
-
50
-
51
-
52
-
53
-
54
-
55
-
56
-
57
-
58
-
59
-
60
-
61
-
62
-
63
-
64
-
65
-
66
-
67
-
68
-
69
-
70
-
71
-
72
-
73
-
74
-
75
-
76
-
77
-
78
-
79
-
80
-
81
-
82
-
83
-
84
-
85
-
86
-
87
-
88
-
89
-
90
-
91
-
92
-
93
-
94
-
95
-
 96
96 -
 97
97 -
 98
98 -
 99
99 -
 100
100 -
 101
101 -
 102
102 -
 103
103 -
 104
104 -
 105
105 -
 106
106 -
 107
107 -
 108
108 -
 109
109 -
 110
110 -
 111
111 -
 112
112 -
 113
113 -
 114
114 -
 115
115 -
 116
116 -
117
-
118
-
119
-
120
-
121
-
122
-
123
-
124
-
125
-
126
-
127
-
128
-
129
-
130
-
131
-
132
-
133
-
134
-
135
-
136
-
137
-
138
-
139
-
140
-
141
-
142
-
143
-
144
-
145
-
146
-
147
-
148
-
149
-
150
-
151
-
152
-
153
-
154
-
155
-
156
-
157
-
158
-
159
-
160
-
161
-
162
-
163
-
164
-
165
-
166
-
167
-
168
-
169
-
170
-
171
-
172
-
173
-
174
-
175
-
176
-
177
-
178
-
179
-
180
-
181
-
182
-
183
-
184
-
185
-
186
-
187
-
188
-
189
-
190
-
191
-
192
-
193
-
194
-
195
-
196
-
197
 |
 |

F-35
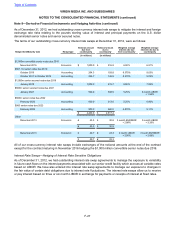
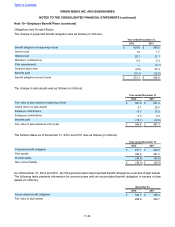
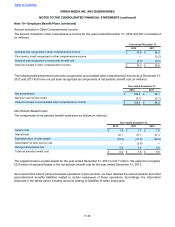
Amount Included in Other Comprehensive Income
The amount included in other comprehensive income for the years ended December 31, 2012 and 2011 consisted of
(in millions):
Year ended December 31,
2012 2011
Actuarial loss recognized in other comprehensive income £ 16.9 £ 24.2
Prior service credit recognized in other comprehensive income — (0.2)
Actuarial loss recognized in net periodic benefit cost (2.6) (3.4)
Amount included in other comprehensive income £ 14.3 £ 20.6
The following table presents the amounts recognized in accumulated other comprehensive income as of December 31,
2012 and 2011 that have not yet been recognized as components of net periodic benefit cost (in millions):
Year ended December 31,
2012 2011
Net actuarial loss £ 108.5 £ 94.1
Net prior year service credit (0.1) (0.1)
Amount included in accumulated other comprehensive income £ 108.4 £ 94.0
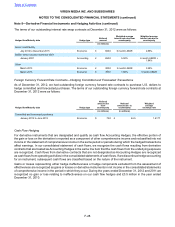
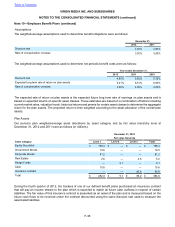
Net Periodic Benefit Costs
The components of net periodic benefit costs were as follows (in millions):
Year ended December 31,
2012 2011 2010
Service cost £ 1.8 £ 1.7 £ 1.6
Interest cost 20.1 21.1 21.4
Expected return on plan assets (18.3) (21.9) (20.8)
Amortization of prior service cost — (2.8) —
Recognized actuarial loss 2.6 3.4 3.6
Total net periodic benefit cost £ 6.2 £ 1.5 £ 5.8
The expected return on plan assets for the year ended December 31, 2013 is £21.7 million. We expect to recognize
£2.0 million of actuarial losses in the net periodic benefit cost for the year ended December 31, 2013.
As a result of the sale of various business operations in prior periods, we have retained the earned pension and other
post-retirement benefits liabilities related to certain employees of those operations. Accordingly, the information
disclosed in the tables above includes amounts relating to liabilities of these employees.
Table of Contents
VIRGIN MEDIA INC. AND SUBSIDIARIES
NOTES TO THE CONSOLIDATED FINANCIAL STATEMENTS (continued)
Note 10—Employee Benefit Plans (continued)