Virgin Media 2012 Annual Report Download - page 140
Download and view the complete annual report
Please find page 140 of the 2012 Virgin Media annual report below. You can navigate through the pages in the report by either clicking on the pages listed below, or by using the keyword search tool below to find specific information within the annual report.-
 1
1 -
2
-
3
-
4
-
5
-
6
-
7
-
8
-
9
-
10
-
11
-
12
-
13
-
14
-
15
-
16
-
17
-
18
-
19
-
20
-
21
-
22
-
23
-
24
-
25
-
26
-
27
-
28
-
29
-
30
-
31
-
32
-
33
-
34
-
35
-
36
-
37
-
38
-
39
-
40
-
41
-
42
-
43
-
44
-
45
-
46
-
47
-
48
-
49
-
50
-
51
-
52
-
53
-
54
-
55
-
56
-
57
-
58
-
59
-
60
-
61
-
62
-
63
-
64
-
65
-
66
-
67
-
68
-
69
-
70
-
71
-
72
-
73
-
74
-
75
-
76
-
77
-
78
-
79
-
80
-
81
-
82
-
83
-
84
-
85
-
86
-
87
-
88
-
89
-
90
-
91
-
92
-
93
-
94
-
95
-
96
-
97
-
98
-
99
-
100
-
101
-
102
-
103
-
104
-
105
-
106
-
107
-
108
-
109
-
110
-
111
-
112
-
113
-
114
-
115
-
116
-
117
-
118
-
119
-
120
-
121
-
122
-
123
-
124
-
125
-
126
-
127
-
128
-
129
-
 130
130 -
 131
131 -
 132
132 -
 133
133 -
 134
134 -
 135
135 -
 136
136 -
 137
137 -
 138
138 -
 139
139 -
 140
140 -
 141
141 -
 142
142 -
 143
143 -
 144
144 -
 145
145 -
 146
146 -
 147
147 -
 148
148 -
 149
149 -
 150
150 -
151
-
152
-
153
-
154
-
155
-
156
-
157
-
158
-
159
-
160
-
161
-
162
-
163
-
164
-
165
-
166
-
167
-
168
-
169
-
170
-
171
-
172
-
173
-
174
-
175
-
176
-
177
-
178
-
179
-
180
-
181
-
182
-
183
-
184
-
185
-
186
-
187
-
188
-
189
-
190
-
191
-
192
-
193
-
194
-
195
-
196
-
197
 |
 |

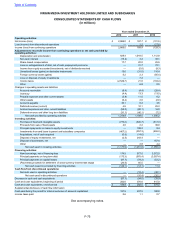
F-69
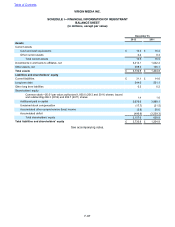
FINANCIAL INFORMATION OF REGISTRANT
STATEMENT OF CASH FLOWS
(in millions)
Year ended December 31,
2012 2011 2010
Net cash used in operating activities £ (91.5) £ (56.1) £ (34.5)
Investing activities
Principal drawdowns on loans to group companies 436.5 621.6 479.9
Net cash provided by investing activities 436.5 621.6 479.9
Financing activities
Repurchase of common stock (330.2) (635.0) (161.5)
Purchase of conversion hedges — — (205.4)
Proceeds from employee stock option exercises, net of taxes reimbursed 8.2 17.5 17.0
Intercompany funding movements — — 22.8
Dividends paid (27.3) (31.1) (34.1)
Net cash used in financing activities (349.3) (648.6) (361.2)
Effect of exchange rate changes on cash and cash equivalents (1.6) (2.0) 4.7
(Decrease) increase in cash and cash equivalents (5.9) (85.1) 88.9
Cash and cash equivalents at beginning of year 16.2 101.3 12.4
Cash and cash equivalents at end of year £ 10.3 £ 16.2 £ 101.3
Supplemental disclosure of cashflow information
Cash paid for interest £ 40.8 £ 40.5 £ 42.2
Income taxes paid — — 1.2
See accompanying notes.
Table of Contents
VIRGIN MEDIA INC.