Virgin Media 2012 Annual Report Download - page 119
Download and view the complete annual report
Please find page 119 of the 2012 Virgin Media annual report below. You can navigate through the pages in the report by either clicking on the pages listed below, or by using the keyword search tool below to find specific information within the annual report.-
 1
1 -
2
-
3
-
4
-
5
-
6
-
7
-
8
-
9
-
10
-
11
-
12
-
13
-
14
-
15
-
16
-
17
-
18
-
19
-
20
-
21
-
22
-
23
-
24
-
25
-
26
-
27
-
28
-
29
-
30
-
31
-
32
-
33
-
34
-
35
-
36
-
37
-
38
-
39
-
40
-
41
-
42
-
43
-
44
-
45
-
46
-
47
-
48
-
49
-
50
-
51
-
52
-
53
-
54
-
55
-
56
-
57
-
58
-
59
-
60
-
61
-
62
-
63
-
64
-
65
-
66
-
67
-
68
-
69
-
70
-
71
-
72
-
73
-
74
-
75
-
76
-
77
-
78
-
79
-
80
-
81
-
82
-
83
-
84
-
85
-
86
-
87
-
88
-
89
-
90
-
91
-
92
-
93
-
94
-
95
-
96
-
97
-
98
-
99
-
100
-
101
-
102
-
103
-
104
-
105
-
106
-
107
-
108
-
 109
109 -
 110
110 -
 111
111 -
 112
112 -
 113
113 -
 114
114 -
 115
115 -
 116
116 -
 117
117 -
 118
118 -
 119
119 -
 120
120 -
 121
121 -
 122
122 -
 123
123 -
 124
124 -
 125
125 -
 126
126 -
 127
127 -
 128
128 -
 129
129 -
130
-
131
-
132
-
133
-
134
-
135
-
136
-
137
-
138
-
139
-
140
-
141
-
142
-
143
-
144
-
145
-
146
-
147
-
148
-
149
-
150
-
151
-
152
-
153
-
154
-
155
-
156
-
157
-
158
-
159
-
160
-
161
-
162
-
163
-
164
-
165
-
166
-
167
-
168
-
169
-
170
-
171
-
172
-
173
-
174
-
175
-
176
-
177
-
178
-
179
-
180
-
181
-
182
-
183
-
184
-
185
-
186
-
187
-
188
-
189
-
190
-
191
-
192
-
193
-
194
-
195
-
196
-
197
 |
 |

F-48
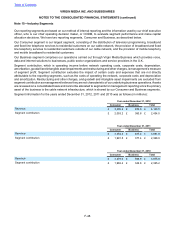
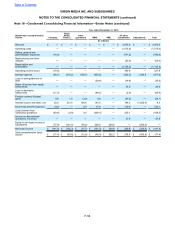
Our reporting segments are based on our method of internal reporting and the information used by our chief executive
officer, who is our chief operating decision maker, or CODM, to evaluate segment performance and make capital
allocation decisions. We have two reporting segments, Consumer and Business, as described below.
Our Consumer segment is our largest segment, consisting of the distribution of television programming, broadband
and fixed line telephone services to residential customers on our cable network, the provision of broadband and fixed
line telephony services to residential customers outside of our cable network, and the provision of mobile telephony
and mobile broadband to residential customers.
Our Business segment comprises our operations carried out through Virgin Media Business which provides voice,
data and internet solutions to businesses, public sector organizations and service providers in the U.K.
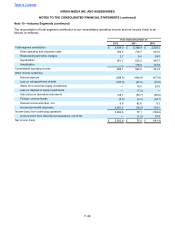
Segment contribution, which is operating income before network operating costs, corporate costs, depreciation,
amortization, goodwill and intangible asset impairments and restructuring and other charges, is management’s measure
of segment profit. Segment contribution excludes the impact of certain costs and expenses that are not directly
attributable to the reporting segments, such as the costs of operating the network, corporate costs and depreciation
and amortization. Restructuring and other charges, and goodwill and intangible asset impairments are excluded from
segment contribution as management believes they are not characteristic of our underlying business operations. Assets
are reviewed on a consolidated basis and cannot be allocated to segments for management reporting since the primary
asset of the business is the cable network infrastructure, which is shared by our Consumer and Business segments.
Segment information for the years ended December 31, 2012, 2011 and 2010 was as follows (in millions):
Year ended December 31, 2012
Consumer Business Total
Revenue £ 3,430.2 £ 670.3 £ 4,100.5
Segment contribution £ 2,053.2 £ 380.8 £ 2,434.0
Year ended December 31, 2011
Consumer Business Total
Revenue £ 3,354.4 £ 637.4 £ 3,991.8
Segment contribution £ 1,991.5 £ 377.4 £ 2,368.9
Year ended December 31, 2010
Consumer Business Total
Revenue £ 3,279.0 £ 596.8 £ 3,875.8
Segment contribution £ 1,982.4 £ 342.8 £ 2,325.2
Table of Contents
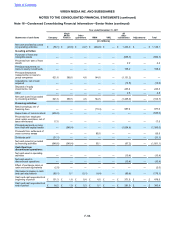
VIRGIN MEDIA INC. AND SUBSIDIARIES
NOTES TO THE CONSOLIDATED FINANCIAL STATEMENTS (continued)
Note 15—Industry Segments