Virgin Media 2012 Annual Report Download - page 50
Download and view the complete annual report
Please find page 50 of the 2012 Virgin Media annual report below. You can navigate through the pages in the report by either clicking on the pages listed below, or by using the keyword search tool below to find specific information within the annual report.-
 1
1 -
2
-
3
-
4
-
5
-
6
-
7
-
8
-
9
-
10
-
11
-
12
-
13
-
14
-
15
-
16
-
17
-
18
-
19
-
20
-
21
-
22
-
23
-
24
-
25
-
26
-
27
-
28
-
29
-
30
-
31
-
32
-
33
-
34
-
35
-
36
-
37
-
38
-
39
-
 40
40 -
 41
41 -
 42
42 -
 43
43 -
 44
44 -
 45
45 -
 46
46 -
 47
47 -
 48
48 -
 49
49 -
 50
50 -
 51
51 -
 52
52 -
 53
53 -
 54
54 -
 55
55 -
 56
56 -
 57
57 -
 58
58 -
 59
59 -
 60
60 -
61
-
62
-
63
-
64
-
65
-
66
-
67
-
68
-
69
-
70
-
71
-
72
-
73
-
74
-
75
-
76
-
77
-
78
-
79
-
80
-
81
-
82
-
83
-
84
-
85
-
86
-
87
-
88
-
89
-
90
-
91
-
92
-
93
-
94
-
95
-
96
-
97
-
98
-
99
-
100
-
101
-
102
-
103
-
104
-
105
-
106
-
107
-
108
-
109
-
110
-
111
-
112
-
113
-
114
-
115
-
116
-
117
-
118
-
119
-
120
-
121
-
122
-
123
-
124
-
125
-
126
-
127
-
128
-
129
-
130
-
131
-
132
-
133
-
134
-
135
-
136
-
137
-
138
-
139
-
140
-
141
-
142
-
143
-
144
-
145
-
146
-
147
-
148
-
149
-
150
-
151
-
152
-
153
-
154
-
155
-
156
-
157
-
158
-
159
-
160
-
161
-
162
-
163
-
164
-
165
-
166
-
167
-
168
-
169
-
170
-
171
-
172
-
173
-
174
-
175
-
176
-
177
-
178
-
179
-
180
-
181
-
182
-
183
-
184
-
185
-
186
-
187
-
188
-
189
-
190
-
191
-
192
-
193
-
194
-
195
-
196
-
197
 |
 |
49
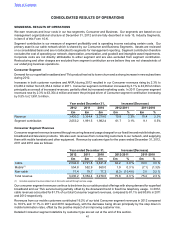
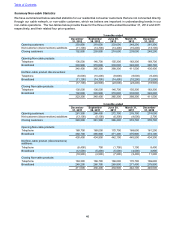
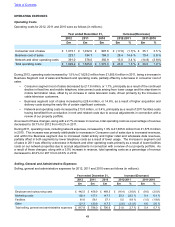
OPERATING EXPENSES
Operating Costs
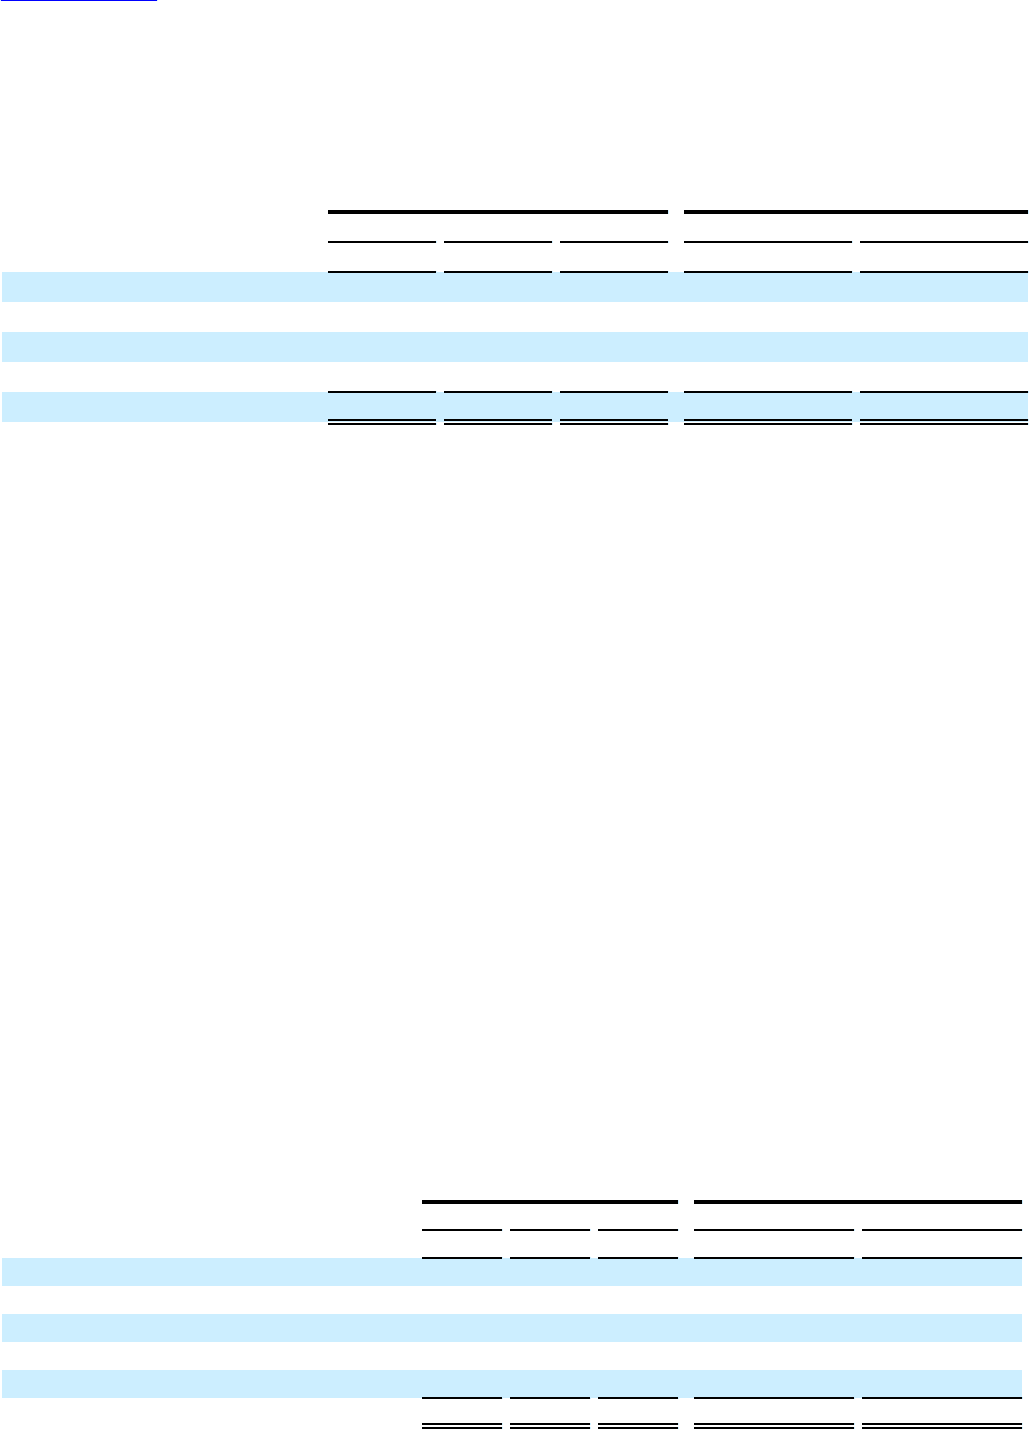
Operating costs for 2012, 2011 and 2010 were as follows (in millions):
Year ended December 31, Increase/(Decrease)
2012 2011 2010 2012-2011 2011-2010
£m £m £m £m % £m %
Consumer cost of sales £ 1,015.1 £ 1,032.9 £ 997.8 £ (17.8) (1.7)% £ 35.1 3.5 %
Business cost of sales 223.1 194.7 184.3 28.4 14.6 % 10.4 5.6 %
Network and other operating costs 391.0 378.0 392.9 13.0 3.4 % (14.9) (3.8)%
Total operating costs £ 1,629.2 £ 1,605.6 £ 1,575.0 £ 23.6 1.5 % £ 30.6 1.9 %
During 2012, operating costs increased by 1.5% to £1,629.2 million from £1,605.6 million in 2011, being a increase in
Business Segment cost of sales and Network and operating costs, partially offset by a decrease in consumer cost of
sales.
• Consumer segment cost of sales decreased by £17.8 million, or 1.7%, principally as a result of the continued
decline in fixed line and mobile telephony interconnect costs arising from lower usage and the step-down in
mobile termination rates, offset by an increase in cable television costs, driven primarily by the increase in
cable television customers.
• Business segment cost of sales increased by £28.4 million, or 14.6%, as a result of higher acquisition and
delivery costs during the early life of certain significant contracts.
• Network and operating costs increased by £13.0 million, or 3.4%, principally as a result of 2011 facilities costs
having benefited from a reduction in rent and related costs due to accrual adjustments in connection with a
review of our property portfolio.
As a result of these changes, along with a 2.7% increase in revenue, total operating costs as a percentage of revenue
decreased to 39.7% for 2012 from 40.2% in 2011.
During 2011, operating costs, including network expenses, increased by 1.9% to £1,605.6 million from £1,575.0 million
in 2010. This increase was primarily attributable to increases in Consumer cost of sales due to increased revenues,
and within the Business segment due to increased install activity and higher retail and wholesale data revenues,
partially offset in both segments by lower telephony costs as a result of lower usage. The increase in segment cost
of sales in 2011 was offset by a decrease in Network and other operating costs primarily as a result of lower facilities
costs on our network properties due to accrual adjustments in connection with a review of our property portfolio. As
a result of these changes, along with a 3.0% increase in revenue, total operating costs as a percentage of revenue
decreased to 40.2% for 2011 from 40.6% in 2010.
Selling, General and Administrative Expenses
Selling, general and administrative expenses for 2012, 2011 and 2010 were as follows (in millions):
Year ended December 31, Increase/(Decrease)
2012 2011 2010 2012-2011 2011-2010
£m £m £m £m % £m %
Employee and outsourcing costs £ 442.5 £ 458.9 £ 468.5 £ (16.4) (3.6)% £ (9.6) (2.0)%
Marketing costs 192.4 157.1 147.7 35.3 22.5 % 9.4 6.4 %
Facilities 61.6 56.1 57.1 5.5 9.8 % (1.0) (1.8)%
Other 121.3 123.9 117.3 (2.6) (2.1)% 6.6 5.6 %
Total selling, general and administrative expenses £ 817.8 £ 796.0 £ 790.6 £ 21.8 2.7 % £ 5.4 0.7 %
Table of Contents