Virgin Media 2012 Annual Report Download - page 108
Download and view the complete annual report
Please find page 108 of the 2012 Virgin Media annual report below. You can navigate through the pages in the report by either clicking on the pages listed below, or by using the keyword search tool below to find specific information within the annual report.-
 1
1 -
2
-
3
-
4
-
5
-
6
-
7
-
8
-
9
-
10
-
11
-
12
-
13
-
14
-
15
-
16
-
17
-
18
-
19
-
20
-
21
-
22
-
23
-
24
-
25
-
26
-
27
-
28
-
29
-
30
-
31
-
32
-
33
-
34
-
35
-
36
-
37
-
38
-
39
-
40
-
41
-
42
-
43
-
44
-
45
-
46
-
47
-
48
-
49
-
50
-
51
-
52
-
53
-
54
-
55
-
56
-
57
-
58
-
59
-
60
-
61
-
62
-
63
-
64
-
65
-
66
-
67
-
68
-
69
-
70
-
71
-
72
-
73
-
74
-
75
-
76
-
77
-
78
-
79
-
80
-
81
-
82
-
83
-
84
-
85
-
86
-
87
-
88
-
89
-
90
-
91
-
92
-
93
-
94
-
95
-
96
-
97
-
 98
98 -
 99
99 -
 100
100 -
 101
101 -
 102
102 -
 103
103 -
 104
104 -
 105
105 -
 106
106 -
 107
107 -
 108
108 -
 109
109 -
 110
110 -
 111
111 -
 112
112 -
 113
113 -
 114
114 -
 115
115 -
 116
116 -
 117
117 -
 118
118 -
119
-
120
-
121
-
122
-
123
-
124
-
125
-
126
-
127
-
128
-
129
-
130
-
131
-
132
-
133
-
134
-
135
-
136
-
137
-
138
-
139
-
140
-
141
-
142
-
143
-
144
-
145
-
146
-
147
-
148
-
149
-
150
-
151
-
152
-
153
-
154
-
155
-
156
-
157
-
158
-
159
-
160
-
161
-
162
-
163
-
164
-
165
-
166
-
167
-
168
-
169
-
170
-
171
-
172
-
173
-
174
-
175
-
176
-
177
-
178
-
179
-
180
-
181
-
182
-
183
-
184
-
185
-
186
-
187
-
188
-
189
-
190
-
191
-
192
-
193
-
194
-
195
-
196
-
197
 |
 |

F-37
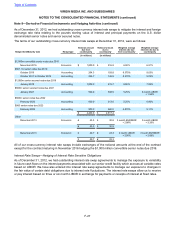
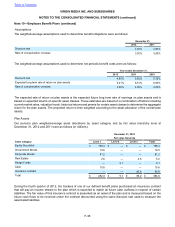
December 31, 2011
Fair value hierarchy
Asset category Level 1 Level 2 Level 3 Total
Equity Securities £ 125.4 £ — £ — £ 125.4
Government Bonds 142.7 — — 142.7
Corporate Bonds 75.0 — — 75.0
Real Estate 4.7 1.9 — 6.6
Hedge Funds — 27.0 — 27.0
Cash 4.3 — — 4.3
Total £ 352.1 £ 28.9 £ — £ 381.0
The substantial majority of plan assets are valued using quoted prices for the holding.
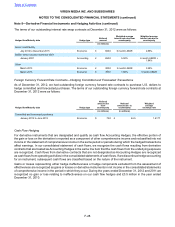
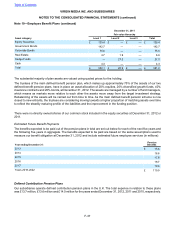
The trustees of the main defined benefit pension plan, which makes up approximately 75% of the assets of our two
defined benefit pension plans, have in place an asset allocation of 20% equities, 20% diversified growth funds, 40%
insurance contracts and 20% bonds, at December 31, 2012. The assets are managed by a number of fund managers,
which means as markets move relative to each other the assets move away from the target investment strategy.
Rebalancing of the assets will be carried out from time to time. As the main defined benefit pension scheme is now
closed to new entrants, the trustees are considering moving towards a higher proportion of matching assets over time
to reflect the steadily maturing profile of the liabilities and the improvement in the funding position.
There were no directly owned shares of our common stock included in the equity securities at December 31, 2012 or
2011.
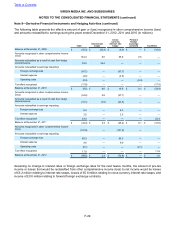
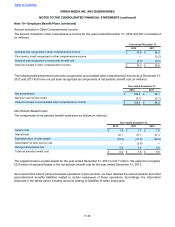
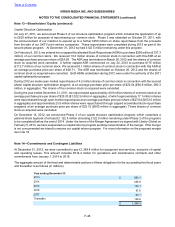
Estimated Future Benefit Payments
The benefits expected to be paid out of the pension plans in total are set out below for each of the next five years and
the following five years in aggregate. The benefits expected to be paid are based on the same assumptions used to
measure our benefit obligation at December 31, 2012 and include estimated future employee services (in millions):
Year ending December 31: Pension
Benefits
2013 £ 15.6
2014 16.6
2015 17.6
2016 18.7
2017 19.8
Years 2018-2022 £ 119.9
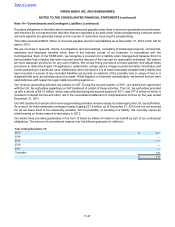
Defined Contribution Pension Plans
Our subsidiaries operate defined contribution pension plans in the U.K. The total expense in relation to these plans
was £13.7 million, £13.6 million and £14.0 million for the years ended December 31, 2012, 2011 and 2010, respectively.
Table of Contents
VIRGIN MEDIA INC. AND SUBSIDIARIES
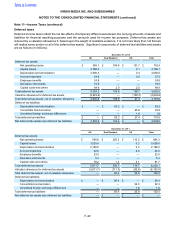
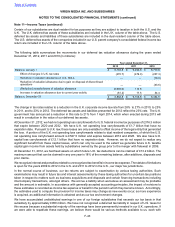
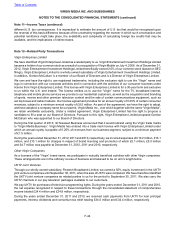
NOTES TO THE CONSOLIDATED FINANCIAL STATEMENTS (continued)
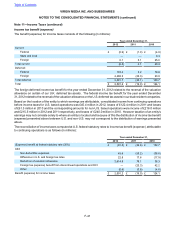
Note 10—Employee Benefit Plans (continued)