Virgin Media 2012 Annual Report Download - page 107
Download and view the complete annual report
Please find page 107 of the 2012 Virgin Media annual report below. You can navigate through the pages in the report by either clicking on the pages listed below, or by using the keyword search tool below to find specific information within the annual report.-
 1
1 -
2
-
3
-
4
-
5
-
6
-
7
-
8
-
9
-
10
-
11
-
12
-
13
-
14
-
15
-
16
-
17
-
18
-
19
-
20
-
21
-
22
-
23
-
24
-
25
-
26
-
27
-
28
-
29
-
30
-
31
-
32
-
33
-
34
-
35
-
36
-
37
-
38
-
39
-
40
-
41
-
42
-
43
-
44
-
45
-
46
-
47
-
48
-
49
-
50
-
51
-
52
-
53
-
54
-
55
-
56
-
57
-
58
-
59
-
60
-
61
-
62
-
63
-
64
-
65
-
66
-
67
-
68
-
69
-
70
-
71
-
72
-
73
-
74
-
75
-
76
-
77
-
78
-
79
-
80
-
81
-
82
-
83
-
84
-
85
-
86
-
87
-
88
-
89
-
90
-
91
-
92
-
93
-
94
-
95
-
96
-
 97
97 -
 98
98 -
 99
99 -
 100
100 -
 101
101 -
 102
102 -
 103
103 -
 104
104 -
 105
105 -
 106
106 -
 107
107 -
 108
108 -
 109
109 -
 110
110 -
 111
111 -
 112
112 -
 113
113 -
 114
114 -
 115
115 -
 116
116 -
 117
117 -
118
-
119
-
120
-
121
-
122
-
123
-
124
-
125
-
126
-
127
-
128
-
129
-
130
-
131
-
132
-
133
-
134
-
135
-
136
-
137
-
138
-
139
-
140
-
141
-
142
-
143
-
144
-
145
-
146
-
147
-
148
-
149
-
150
-
151
-
152
-
153
-
154
-
155
-
156
-
157
-
158
-
159
-
160
-
161
-
162
-
163
-
164
-
165
-
166
-
167
-
168
-
169
-
170
-
171
-
172
-
173
-
174
-
175
-
176
-
177
-
178
-
179
-
180
-
181
-
182
-
183
-
184
-
185
-
186
-
187
-
188
-
189
-
190
-
191
-
192
-
193
-
194
-
195
-
196
-
197
 |
 |

F-36
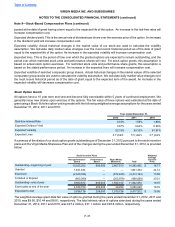
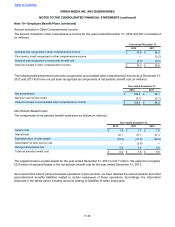
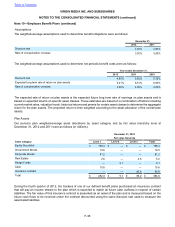
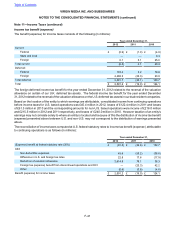
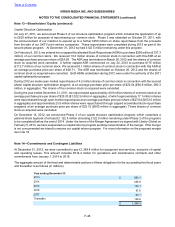
Assumptions
The weighted-average assumptions used to determine benefit obligations were as follows:
December 31,
2012 2011
Discount rate 4.40% 4.80%
Rate of compensation increase 3.30% 3.50%
The weighted-average assumptions used to determine net periodic benefit costs were as follows:
Year ended December 31,
2012 2011 2010
Discount rate 4.80% 5.50% 5.75%
Expected long term rate of return on plan assets 5.41% 6.31% 6.50%
Rate of compensation increase 3.50% 4.00% 4.00%
The expected rate of return on plan assets is the expected future long term rate of earnings on plan assets and is
based on expected returns on specific asset classes. These estimates are based on a combination of factors including
current market rates, valuation levels, historical returns and premia for certain asset classes to determine the aggregate
return for the plan assets. The projected return is then weighted according to the asset allocation of the overall plan
assets.
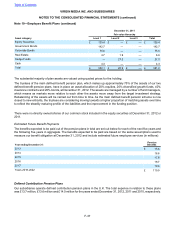
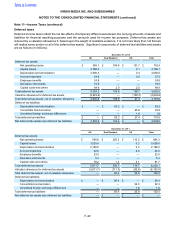
Plan Assets
Our pension plan weighted-average asset allocations by asset category and by fair value hierarchy level at
December 31, 2012 and 2011 were as follows (in millions):
December 31, 2012
Fair value hierarchy
Asset category Level 1 Level 2 Level 3 Total
Equity Securities £ 168.4 £ — £ — £ 168.4
Government Bonds 19.5 — — 19.5
Corporate Bonds 81.2 — — 81.2
Real Estate 2.6 — 2.6 5.2
Hedge Funds — 9.1 — 9.1
Cash 10.6 — — 10.6
Insurance contract — — 90.6 90.6
Total £ 282.3 £ 9.1 £ 93.2 £ 384.6
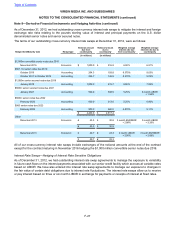
During the fourth quarter of 2012, the trustees of one of our defined benefit plans purchased an insurance contract
that will pay an income stream to the plan which is expected to match all future cash outflows in respect of certain
liabilities. The fair value of this insurance contract is presented as an asset of the plan and is measured based on the
future cash flows to be received under the contract discounted using the same discount rate used to measure the
associated liabilities.
Table of Contents
VIRGIN MEDIA INC. AND SUBSIDIARIES
NOTES TO THE CONSOLIDATED FINANCIAL STATEMENTS (continued)
Note 10—Employee Benefit Plans (continued)