Virgin Media 2012 Annual Report Download - page 172
Download and view the complete annual report
Please find page 172 of the 2012 Virgin Media annual report below. You can navigate through the pages in the report by either clicking on the pages listed below, or by using the keyword search tool below to find specific information within the annual report.-
 1
1 -
2
-
3
-
4
-
5
-
6
-
7
-
8
-
9
-
10
-
11
-
12
-
13
-
14
-
15
-
16
-
17
-
18
-
19
-
20
-
21
-
22
-
23
-
24
-
25
-
26
-
27
-
28
-
29
-
30
-
31
-
32
-
33
-
34
-
35
-
36
-
37
-
38
-
39
-
40
-
41
-
42
-
43
-
44
-
45
-
46
-
47
-
48
-
49
-
50
-
51
-
52
-
53
-
54
-
55
-
56
-
57
-
58
-
59
-
60
-
61
-
62
-
63
-
64
-
65
-
66
-
67
-
68
-
69
-
70
-
71
-
72
-
73
-
74
-
75
-
76
-
77
-
78
-
79
-
80
-
81
-
82
-
83
-
84
-
85
-
86
-
87
-
88
-
89
-
90
-
91
-
92
-
93
-
94
-
95
-
96
-
97
-
98
-
99
-
100
-
101
-
102
-
103
-
104
-
105
-
106
-
107
-
108
-
109
-
110
-
111
-
112
-
113
-
114
-
115
-
116
-
117
-
118
-
119
-
120
-
121
-
122
-
123
-
124
-
125
-
126
-
127
-
128
-
129
-
130
-
131
-
132
-
133
-
134
-
135
-
136
-
137
-
138
-
139
-
140
-
141
-
142
-
143
-
144
-
145
-
146
-
147
-
148
-
149
-
150
-
151
-
152
-
153
-
154
-
155
-
156
-
157
-
158
-
159
-
160
-
161
-
 162
162 -
 163
163 -
 164
164 -
 165
165 -
 166
166 -
 167
167 -
 168
168 -
 169
169 -
 170
170 -
 171
171 -
 172
172 -
 173
173 -
 174
174 -
 175
175 -
 176
176 -
 177
177 -
 178
178 -
 179
179 -
 180
180 -
 181
181 -
 182
182 -
183
-
184
-
185
-
186
-
187
-
188
-
189
-
190
-
191
-
192
-
193
-
194
-
195
-
196
-
197
 |
 |

F-101
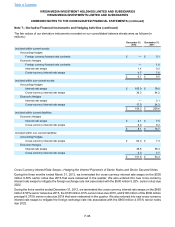
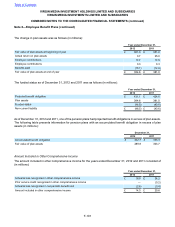
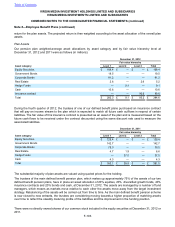
The change in plan assets was as follows (in millions):
Year ended December 31,
2012 2011
Fair value of plan assets at beginning of year £ 381.0 £ 351.0
Actual return on plan assets 0.7 25.0
Employer contributions 17.7 17.5
Employee contributions 0.3 0.3
Benefits paid (15.1) (12.8)
Fair value of plan assets at end of year £ 384.6 £ 381.0
The funded status as of December 31, 2012 and 2011 was as follows (in millions):
Year ended December 31,
2012 2011
Projected benefit obligation £ 431.1 £ 424.6
Plan assets 384.6 381.0
Funded status (46.5) (43.6)
Non-current liability £ (46.5) £ (43.6)
As of December 31, 2012 and 2011, one of the pension plans had projected benefit obligations in excess of plan assets.
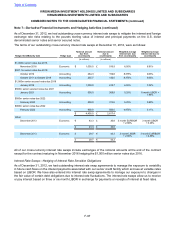
The following table presents information for pension plans with an accumulated benefit obligation in excess of plan
assets (in millions):
December 31,
2012 2011
Accumulated benefit obligation £ 342.7 £ 335.3
Fair value of plan assets 289.8 303.7
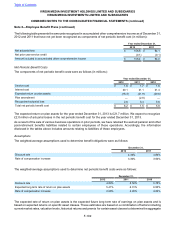
Amount Included in Other Comprehensive Income
The amount included in other comprehensive income for the years ended December 31, 2012 and 2011 consisted of
(in millions):
Year ended December 31,
2012 2011
Actuarial loss recognized in other comprehensive income £ 16.9 £ 24.2
Prior service credit recognized in other comprehensive income — (0.2)
Actuarial loss recognized in net periodic benefit cost (2.6) (3.4)
Amount included in other comprehensive income £ 14.3 £ 20.6
Table of Contents
VIRGIN MEDIA INVESTMENT HOLDINGS LIMITED AND SUBSIDIARIES
VIRGIN MEDIA INVESTMENTS LIMITED AND SUBSIDIARIES
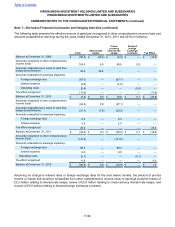
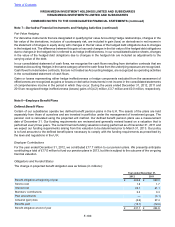
COMBINED NOTES TO THE CONSOLIDATED FINANCIAL STATEMENTS (continued)
Note 8—Employee Benefit Plans (continued)