Virgin Media 2012 Annual Report Download - page 122
Download and view the complete annual report
Please find page 122 of the 2012 Virgin Media annual report below. You can navigate through the pages in the report by either clicking on the pages listed below, or by using the keyword search tool below to find specific information within the annual report.-
 1
1 -
2
-
3
-
4
-
5
-
6
-
7
-
8
-
9
-
10
-
11
-
12
-
13
-
14
-
15
-
16
-
17
-
18
-
19
-
20
-
21
-
22
-
23
-
24
-
25
-
26
-
27
-
28
-
29
-
30
-
31
-
32
-
33
-
34
-
35
-
36
-
37
-
38
-
39
-
40
-
41
-
42
-
43
-
44
-
45
-
46
-
47
-
48
-
49
-
50
-
51
-
52
-
53
-
54
-
55
-
56
-
57
-
58
-
59
-
60
-
61
-
62
-
63
-
64
-
65
-
66
-
67
-
68
-
69
-
70
-
71
-
72
-
73
-
74
-
75
-
76
-
77
-
78
-
79
-
80
-
81
-
82
-
83
-
84
-
85
-
86
-
87
-
88
-
89
-
90
-
91
-
92
-
93
-
94
-
95
-
96
-
97
-
98
-
99
-
100
-
101
-
102
-
103
-
104
-
105
-
106
-
107
-
108
-
109
-
110
-
111
-
 112
112 -
 113
113 -
 114
114 -
 115
115 -
 116
116 -
 117
117 -
 118
118 -
 119
119 -
 120
120 -
 121
121 -
 122
122 -
 123
123 -
 124
124 -
 125
125 -
 126
126 -
 127
127 -
 128
128 -
 129
129 -
 130
130 -
 131
131 -
 132
132 -
133
-
134
-
135
-
136
-
137
-
138
-
139
-
140
-
141
-
142
-
143
-
144
-
145
-
146
-
147
-
148
-
149
-
150
-
151
-
152
-
153
-
154
-
155
-
156
-
157
-
158
-
159
-
160
-
161
-
162
-
163
-
164
-
165
-
166
-
167
-
168
-
169
-
170
-
171
-
172
-
173
-
174
-
175
-
176
-
177
-
178
-
179
-
180
-
181
-
182
-
183
-
184
-
185
-
186
-
187
-
188
-
189
-
190
-
191
-
192
-
193
-
194
-
195
-
196
-
197
 |
 |
F-51
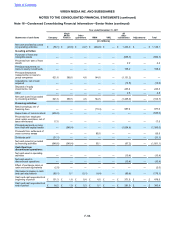
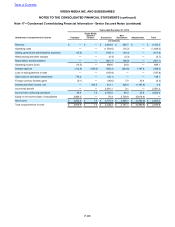
December 31, 2011
Balance sheets Company
Virgin
Media
Finance Other
guarantors VMIH VMIL All other
subsidiaries Adjustments Total
(in millions)
Cash and cash equivalents £ 16.2 £ 1.9 £ 0.3 £ 0.1 £ — £ 281.9 £ — £ 300.4
Restricted cash — — — — — 1.9 — 1.9
Other current assets 0.3 — 1.0 16.3 —524.3 —541.9
Total current assets 16.5 1.9 1.3 16.4 —808.1 —844.2
Fixed assets, net — — — — — 4,602.7 — 4,602.7
Goodwill and intangible
assets, net — — (15.0) — — 2,032.5 — 2,017.5
Investments in, and loans to,
parent and subsidiary
companies 1,042.2 330.2 (841.2) 1,474.5 2,217.5 (2,902.6) (1,320.6) —
Other assets, net 146.1 23.5 — 208.4 —96.4 —474.4
Total assets £ 1,204.8 £ 355.6 £ (854.9) £ 1,699.3 £ 2,217.5 £ 4,637.1 £ (1,320.6) £ 7,938.8
Current liabilities £ 14.6 £ 52.2 £ 13.6 £ 101.2 £ — £ 1,897.8 £ (801.6) £ 1,277.8
Long term debt, net of current
portion 551.1 1,720.3 — — — 3,507.1 — 5,778.5
Other long term liabilities 0.2 — — 45.8 —197.6 —243.6
Total liabilities 565.9 1,772.5 13.6 147.0 — 5,602.5 (801.6)7,299.9
Shareholders’ equity (deficit) 638.9 (1,416.9) (868.5) 1,552.3 2,217.5 (965.4) (519.0)638.9
Total liabilities and
shareholders’ equity
(deficit) £ 1,204.8 £ 355.6 £ (854.9) £ 1,699.3 £ 2,217.5 £ 4,637.1 £ (1,320.6) £ 7,938.8
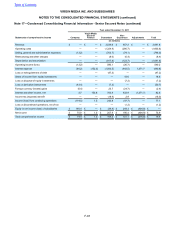
Table of Contents
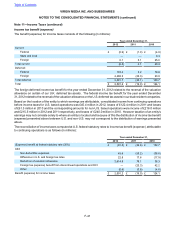
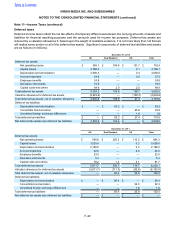
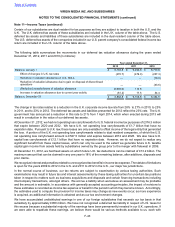
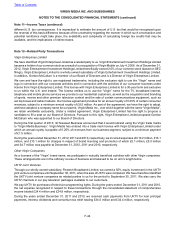
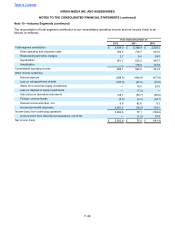
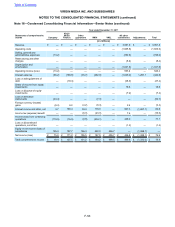
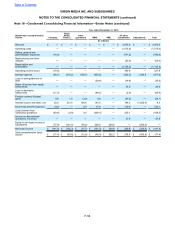
VIRGIN MEDIA INC. AND SUBSIDIARIES
NOTES TO THE CONSOLIDATED FINANCIAL STATEMENTS (continued)
Note 16—Condensed Consolidating Financial Information—Senior Notes (continued)