Virgin Media 2012 Annual Report Download - page 159
Download and view the complete annual report
Please find page 159 of the 2012 Virgin Media annual report below. You can navigate through the pages in the report by either clicking on the pages listed below, or by using the keyword search tool below to find specific information within the annual report.-
 1
1 -
2
-
3
-
4
-
5
-
6
-
7
-
8
-
9
-
10
-
11
-
12
-
13
-
14
-
15
-
16
-
17
-
18
-
19
-
20
-
21
-
22
-
23
-
24
-
25
-
26
-
27
-
28
-
29
-
30
-
31
-
32
-
33
-
34
-
35
-
36
-
37
-
38
-
39
-
40
-
41
-
42
-
43
-
44
-
45
-
46
-
47
-
48
-
49
-
50
-
51
-
52
-
53
-
54
-
55
-
56
-
57
-
58
-
59
-
60
-
61
-
62
-
63
-
64
-
65
-
66
-
67
-
68
-
69
-
70
-
71
-
72
-
73
-
74
-
75
-
76
-
77
-
78
-
79
-
80
-
81
-
82
-
83
-
84
-
85
-
86
-
87
-
88
-
89
-
90
-
91
-
92
-
93
-
94
-
95
-
96
-
97
-
98
-
99
-
100
-
101
-
102
-
103
-
104
-
105
-
106
-
107
-
108
-
109
-
110
-
111
-
112
-
113
-
114
-
115
-
116
-
117
-
118
-
119
-
120
-
121
-
122
-
123
-
124
-
125
-
126
-
127
-
128
-
129
-
130
-
131
-
132
-
133
-
134
-
135
-
136
-
137
-
138
-
139
-
140
-
141
-
142
-
143
-
144
-
145
-
146
-
147
-
148
-
 149
149 -
 150
150 -
 151
151 -
 152
152 -
 153
153 -
 154
154 -
 155
155 -
 156
156 -
 157
157 -
 158
158 -
 159
159 -
 160
160 -
 161
161 -
 162
162 -
 163
163 -
 164
164 -
 165
165 -
 166
166 -
 167
167 -
 168
168 -
 169
169 -
170
-
171
-
172
-
173
-
174
-
175
-
176
-
177
-
178
-
179
-
180
-
181
-
182
-
183
-
184
-
185
-
186
-
187
-
188
-
189
-
190
-
191
-
192
-
193
-
194
-
195
-
196
-
197
 |
 |

F-88
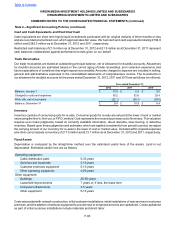
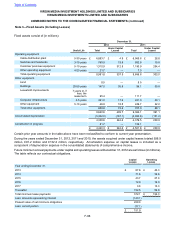
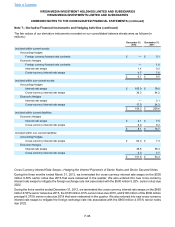
Fixed assets consist of (in millions):
December 31,
2012 2011
Useful Life Total Under Capital
Leases Total Under Capital
Leases
Operating equipment
Cable distribution plant 5-30 years £ 6,883.7 £ 4.9 £ 6,565.8 £ 28.8
Switches and headends 3-10 years 765.5 19.8 892.8 19.8
Customer premises equipment 5-10 years 1,310.9 312.8 1,190.9 254.4
Other operating equipment 4-20 years 21.7 — 7.3 —
Total operating equipment 8,981.8 337.5 8,656.8 303.0
Other equipment
Land 8.5 — 8.5 —
Buildings 20-50 years 147.0 35.8 96.1 35.8
Leasehold improvements 7 years or, if
less, the
lease term 95.4 — 111.7 —
Computer infrastructure 3-5 years 361.0 17.6 241.3 30.1
Other equipment 5-10 years 46.9 18.8 249.7 22.2
Total other equipment 658.8 72.2 707.3 88.1
9,640.6 409.7 9,364.1 391.1
Accumulated depreciation (5,302.0) (167.1) (4,984.6) (151.2)
4,338.6 242.6 4,379.5 239.9
Construction in progress 81.7 — 122.1 —
£ 4,420.3 £ 242.6 £ 4,501.6 £ 239.9
Certain prior year amounts in the table above have been reclassified to conform to current year presentation.
During the years ended December 31, 2012, 2011 and 2010, the assets acquired under capital leases totaled £88.9
million, £91.2 million and £132.2 million, respectively. Amortization expense on capital leases is included as a
component of depreciation expense in the consolidated statements of comprehensive income.
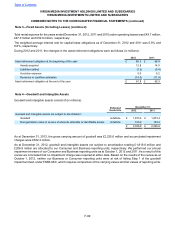
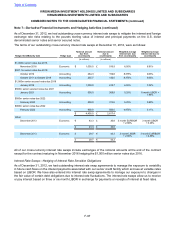
Future minimum annual payments under capital and operating leases at December 31, 2012 are as follows (in millions).
The table reflects our contractual obligations.
Capital
Leases Operating
Leases
Year ending December 31,
2013 £ 87.6 £ 40.3
2014 71.6 32.6
2015 43.7 27.0
2016 12.9 19.3
2017 3.8 13.3
Thereafter 152.5 59.8
Total minimum lease payments 372.1 £ 192.3
Less: amounts representing interest (143.1)
Present value of net minimum obligations 229.0
Less: current portion (77.1)
£ 151.9
Table of Contents
VIRGIN MEDIA INVESTMENT HOLDINGS LIMITED AND SUBSIDIARIES
VIRGIN MEDIA INVESTMENTS LIMITED AND SUBSIDIARIES
COMBINED NOTES TO THE CONSOLIDATED FINANCIAL STATEMENTS (continued)
Note 3—Fixed Assets (Including Leases)