Virgin Media 2012 Annual Report Download - page 160
Download and view the complete annual report
Please find page 160 of the 2012 Virgin Media annual report below. You can navigate through the pages in the report by either clicking on the pages listed below, or by using the keyword search tool below to find specific information within the annual report.-
 1
1 -
2
-
3
-
4
-
5
-
6
-
7
-
8
-
9
-
10
-
11
-
12
-
13
-
14
-
15
-
16
-
17
-
18
-
19
-
20
-
21
-
22
-
23
-
24
-
25
-
26
-
27
-
28
-
29
-
30
-
31
-
32
-
33
-
34
-
35
-
36
-
37
-
38
-
39
-
40
-
41
-
42
-
43
-
44
-
45
-
46
-
47
-
48
-
49
-
50
-
51
-
52
-
53
-
54
-
55
-
56
-
57
-
58
-
59
-
60
-
61
-
62
-
63
-
64
-
65
-
66
-
67
-
68
-
69
-
70
-
71
-
72
-
73
-
74
-
75
-
76
-
77
-
78
-
79
-
80
-
81
-
82
-
83
-
84
-
85
-
86
-
87
-
88
-
89
-
90
-
91
-
92
-
93
-
94
-
95
-
96
-
97
-
98
-
99
-
100
-
101
-
102
-
103
-
104
-
105
-
106
-
107
-
108
-
109
-
110
-
111
-
112
-
113
-
114
-
115
-
116
-
117
-
118
-
119
-
120
-
121
-
122
-
123
-
124
-
125
-
126
-
127
-
128
-
129
-
130
-
131
-
132
-
133
-
134
-
135
-
136
-
137
-
138
-
139
-
140
-
141
-
142
-
143
-
144
-
145
-
146
-
147
-
148
-
149
-
 150
150 -
 151
151 -
 152
152 -
 153
153 -
 154
154 -
 155
155 -
 156
156 -
 157
157 -
 158
158 -
 159
159 -
 160
160 -
 161
161 -
 162
162 -
 163
163 -
 164
164 -
 165
165 -
 166
166 -
 167
167 -
 168
168 -
 169
169 -
 170
170 -
171
-
172
-
173
-
174
-
175
-
176
-
177
-
178
-
179
-
180
-
181
-
182
-
183
-
184
-
185
-
186
-
187
-
188
-
189
-
190
-
191
-
192
-
193
-
194
-
195
-
196
-
197
 |
 |
F-89
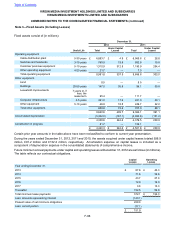
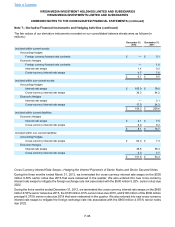
Total rental expense for the years ended December 31, 2012, 2011 and 2010 under operating leases was £49.7 million,
£47.0 million and £52.6 million, respectively.
The weighted average interest rate for capital lease obligations as of December 31, 2012 and 2011 was 5.8% and
6.8%, respectively.
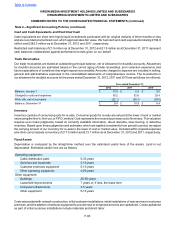
During 2012 and 2011, the changes in the asset retirement obligations were as follows (in millions):
2012 2011
Asset retirement obligation at the beginning of the year £ 65.3 £ 66.4
Assets acquired 12.8 14.0
Liabilities settled (7.2) (8.4)
Accretion expense 5.0 5.2
Revisions in cashflow estimates (14.0) (11.9)
Asset retirement obligation at the end of the year £ 61.9 £ 65.3
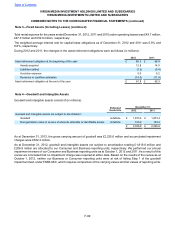
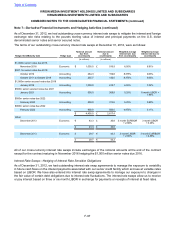
Note 4—Goodwill and Intangible Assets
Goodwill and intangible assets consist of (in millions):
Estimated
Useful Life
December 31,
2012 2011
Goodwill and intangible assets not subject to amortization:
Goodwill indefinite £ 1,873.4 £ 1,873.4
Reorganization value in excess of amounts allocable to identifiable assets indefinite 153.2 153.2
£ 2,026.6 £ 2,026.6
As at December 31, 2012, the gross carrying amount of goodwill was £2,235.6 million and accumulated impairment
charges were £362.2 million.
As at December 31, 2012, goodwill and intangible assets not subject to amortization totaling £1,819.8 million and
£206.8 million are allocated to our Consumer and Business reporting units, respectively. We performed our annual
impairment reviews of our Consumer and Business reporting units as at October 1, 2012 and 2011. As a result of this
review we concluded that no impairment charge was required at either date. Based on the results of the review as at
October 1, 2012, neither our Business or Consumer reporting units were at risk of failing Step 1 of the goodwill
impairment test, under FASB ASC, which requires comparison of the carrying values and fair values of reporting units.
Table of Contents
VIRGIN MEDIA INVESTMENT HOLDINGS LIMITED AND SUBSIDIARIES
VIRGIN MEDIA INVESTMENTS LIMITED AND SUBSIDIARIES
COMBINED NOTES TO THE CONSOLIDATED FINANCIAL STATEMENTS (continued)
Note 3—Fixed Assets (Including Leases) (continued)