Virgin Media 2012 Annual Report Download - page 42
Download and view the complete annual report
Please find page 42 of the 2012 Virgin Media annual report below. You can navigate through the pages in the report by either clicking on the pages listed below, or by using the keyword search tool below to find specific information within the annual report.-
 1
1 -
2
-
3
-
4
-
5
-
6
-
7
-
8
-
9
-
10
-
11
-
12
-
13
-
14
-
15
-
16
-
17
-
18
-
19
-
20
-
21
-
22
-
23
-
24
-
25
-
26
-
27
-
28
-
29
-
30
-
31
-
 32
32 -
 33
33 -
 34
34 -
 35
35 -
 36
36 -
 37
37 -
 38
38 -
 39
39 -
 40
40 -
 41
41 -
 42
42 -
 43
43 -
 44
44 -
 45
45 -
 46
46 -
 47
47 -
 48
48 -
 49
49 -
 50
50 -
 51
51 -
 52
52 -
53
-
54
-
55
-
56
-
57
-
58
-
59
-
60
-
61
-
62
-
63
-
64
-
65
-
66
-
67
-
68
-
69
-
70
-
71
-
72
-
73
-
74
-
75
-
76
-
77
-
78
-
79
-
80
-
81
-
82
-
83
-
84
-
85
-
86
-
87
-
88
-
89
-
90
-
91
-
92
-
93
-
94
-
95
-
96
-
97
-
98
-
99
-
100
-
101
-
102
-
103
-
104
-
105
-
106
-
107
-
108
-
109
-
110
-
111
-
112
-
113
-
114
-
115
-
116
-
117
-
118
-
119
-
120
-
121
-
122
-
123
-
124
-
125
-
126
-
127
-
128
-
129
-
130
-
131
-
132
-
133
-
134
-
135
-
136
-
137
-
138
-
139
-
140
-
141
-
142
-
143
-
144
-
145
-
146
-
147
-
148
-
149
-
150
-
151
-
152
-
153
-
154
-
155
-
156
-
157
-
158
-
159
-
160
-
161
-
162
-
163
-
164
-
165
-
166
-
167
-
168
-
169
-
170
-
171
-
172
-
173
-
174
-
175
-
176
-
177
-
178
-
179
-
180
-
181
-
182
-
183
-
184
-
185
-
186
-
187
-
188
-
189
-
190
-
191
-
192
-
193
-
194
-
195
-
196
-
197
 |
 |

41
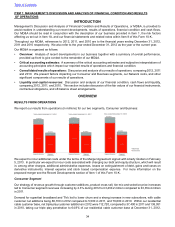
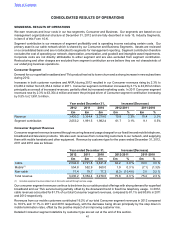
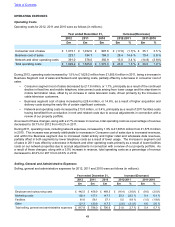
CONSOLIDATED RESULTS OF OPERATIONS
SEGMENTAL RESULTS OF OPERATIONS
We earn revenues and incur costs in our two segments, Consumer and Business. Our segments are based on our
management organizational structure at December 31, 2012 and are fully described in note 15, Industry Segments,
in item 8 of this Form 10-K.
Segment contribution is our measure of segment profitability and is operating income excluding certain costs. Our
primary asset is our cable network which is shared by our Consumer and Business Segments. Assets are reviewed
on a consolidated basis and are not allocated to segments for management reporting. Segment contribution therefore
excludes the cost of operating our network, depreciation, amortization, and goodwill and intangible asset impairments.
Corporate costs are not directly attributable to either segment and are also excluded from segment contribution.
Restructuring and other charges are excluded from segment contribution as we believe they are not characteristic of
our underlying business operations.
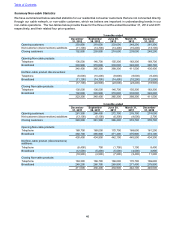
Consumer Segment
Demand for our superfast broadband and TiVo product has led to lower churn and a strong increase in new subscribers
during 2012.
Increases in both customer numbers and ARPU during 2012 resulted in our Consumer revenues rising by 2.3% to
£3,430.2 million from £3,354.4 million in 2011. Consumer segment contribution increased by 3.1% to £2,053.2 million
principally as a result of increased revenues, partially offset by increased marketing costs. In 2011 Consumer segment
revenues rose by 2.3% to £3,354.4 million and were the principal driver of Consumer segment contribution increasing
by 0.5% to £1,991.5 million.
Year ended December 31, Increase/(Decrease)
2012 2011 2010 2012-2011 2011-2010
£m £m £m £m % £m %
Revenue 3,430.2 3,354.4 3,279.0 75.8 2.3% 75.4 2.3%
Segment contribution 2,053.2 1,991.5 1,982.4 61.7 3.1% 9.1 0.5%
Consumer Segment Revenue
Consumer segment revenue is earned through recurring fees and usage charges for our fixed line and mobile telephone,
broadband and television products. We also earn revenues from connecting customers to our network, and supplying
them with mobile handsets and other equipment. Revenue by customer type for the years ended December 31, 2012,
2011 and 2010 was as follows:
Year ended December 31, Increase/(Decrease)
2012 2011 2010 2012-2011 2011-2010
£m £m £m £m % £m %
Cable 2,804.0 2,721.8 2,641.8 82.2 3.0 % 80.0 3.0 %
Mobile(1) 554.8 552.9 560.0 1.9 0.3 % (7.1) (1.3)%
Non-cable 71.4 79.7 77.2 (8.3) (10.4)% 2.5 3.2 %
Total revenue 3,430.2 3,354.4 3,279.0 75.8 2.3 % 75.4 2.3 %
(1) Includes equipment revenue stated net of discounts earned through service usage.
Our consumer segment revenues continue to be driven by our cable product offerings with strong demand for superfast
broadband and our TiVo service being partially offset by the downward trend in fixed line telephony usage. In 2012,
cable revenues accounted for 81.7% of our total Consumer segment revenues, compared to 81.1% and 80.6% in 2011
and 2010 respectively.
Revenues from our mobile customers contributed 16.2% of our total Consumer segment revenues in 2012 compared
to 16.5% and 17.1% in 2011 and 2010 respectively, with the decrease being driven principally by the step down in
mobile termination rates, offset by the positive impact of an improving customer mix.
Detailed Consumer segment statistics by customer type are set out at the end of this section.
Table of Contents