Virgin Media 2012 Annual Report Download - page 150
Download and view the complete annual report
Please find page 150 of the 2012 Virgin Media annual report below. You can navigate through the pages in the report by either clicking on the pages listed below, or by using the keyword search tool below to find specific information within the annual report.-
 1
1 -
2
-
3
-
4
-
5
-
6
-
7
-
8
-
9
-
10
-
11
-
12
-
13
-
14
-
15
-
16
-
17
-
18
-
19
-
20
-
21
-
22
-
23
-
24
-
25
-
26
-
27
-
28
-
29
-
30
-
31
-
32
-
33
-
34
-
35
-
36
-
37
-
38
-
39
-
40
-
41
-
42
-
43
-
44
-
45
-
46
-
47
-
48
-
49
-
50
-
51
-
52
-
53
-
54
-
55
-
56
-
57
-
58
-
59
-
60
-
61
-
62
-
63
-
64
-
65
-
66
-
67
-
68
-
69
-
70
-
71
-
72
-
73
-
74
-
75
-
76
-
77
-
78
-
79
-
80
-
81
-
82
-
83
-
84
-
85
-
86
-
87
-
88
-
89
-
90
-
91
-
92
-
93
-
94
-
95
-
96
-
97
-
98
-
99
-
100
-
101
-
102
-
103
-
104
-
105
-
106
-
107
-
108
-
109
-
110
-
111
-
112
-
113
-
114
-
115
-
116
-
117
-
118
-
119
-
120
-
121
-
122
-
123
-
124
-
125
-
126
-
127
-
128
-
129
-
130
-
131
-
132
-
133
-
134
-
135
-
136
-
137
-
138
-
139
-
 140
140 -
 141
141 -
 142
142 -
 143
143 -
 144
144 -
 145
145 -
 146
146 -
 147
147 -
 148
148 -
 149
149 -
 150
150 -
 151
151 -
 152
152 -
 153
153 -
 154
154 -
 155
155 -
 156
156 -
 157
157 -
 158
158 -
 159
159 -
 160
160 -
161
-
162
-
163
-
164
-
165
-
166
-
167
-
168
-
169
-
170
-
171
-
172
-
173
-
174
-
175
-
176
-
177
-
178
-
179
-
180
-
181
-
182
-
183
-
184
-
185
-
186
-
187
-
188
-
189
-
190
-
191
-
192
-
193
-
194
-
195
-
196
-
197
 |
 |

F-79
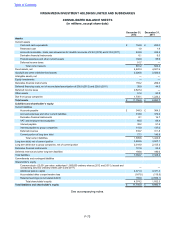
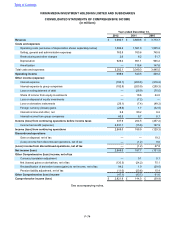
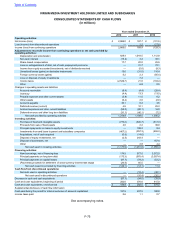
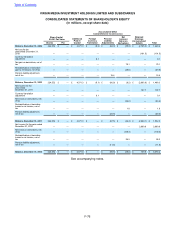
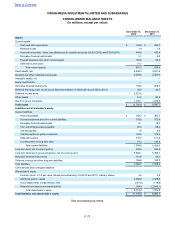
VIRGIN MEDIA INVESTMENTS LIMITED AND SUBSIDIARIES
CONSOLIDATED STATEMENTS OF CASH FLOW
(in millions)
Year ended December 31,
2012 2011 2010
Operating activities:
Net income (loss) £ 2,869.0 £ 187.7 £(101.5)
Loss (income) from discontinued operations — 1.2 (27.8)
Income (loss) from continuing operations 2,869.0 188.9 (129.3)
Adjustments to reconcile income from continuing operations to net cash provided by
operating activities:
Depreciation and amortization 929.4 1,019.5 1,112.8
Non-cash interest (15.2) 3.2 36.1
Share-based compensation 17.7 20.0 25.9
Loss on extinguishment of debt, net of cash prepayment premiums — 31.7 70.1
Income from equity accounted investments, net of dividends received — (0.6)(9.3)
Unrealized losses (gains) on derivative instruments 13.6 (31.0)116.4
Foreign currency losses (gains) 0.2 2.3 (85.4)
Loss on disposal of equity investments — 7.2 —
Income taxes (2,529.7) 21.0 (104.4)
Other — 6.8 0.5
Changes in operating assets and liabilities:
Accounts receivable (8.4)(4.4)(28.4)
Inventory (4.4)13.3 (13.5)
Prepaid expenses and other current assets (5.8)11.5 6.2
Other assets (0.4) 2.0 (2.0)
Accounts payable 30.1 8.2 4.5
Deferred revenue (current) 4.9 10.1 25.3
Accrued expenses and other current liabilities (55.0)(80.1)16.9
Deferred revenue and other long term liabilities (31.1)(40.1)(7.2)
Net cash provided by operating activities 1,214.9 1,189.5 1,035.2
Investing activities:
Purchase of fixed and intangible assets (770.2) (645.7)(617.3)
Proceeds from sale of fixed assets 2.6 2.2 36.0
Principal repayments on loans to equity investments — 108.2 8.4
Investments from and loans to parent and subsidiary companies (407.2) (833.3)587.2
Acquisitions, net of cash acquired (0.6)(14.6) —
Disposal of equity investments, net (2.5)243.4 —
Disposal of businesses, net — — 167.4
Other — 2.8 4.4
Net cash (used in) provided by investing activities (1,177.9) (1,137.0) 186.1
Financing activities:
New borrowings, net of financing fees (0.1)107.1 108.1
Principal payments on long term debt (0.3)(229.5) (1,286.0)
Principal payments on capital leases (97.7)(79.2)(53.2)
(Payments) proceeds for settlement of cross-currency interest rate swaps (26.0)65.5 —
Net cash used in financing activities (124.1) (136.1) (1,231.1)
Cash flow from discontinued operations:
Net cash used in operating activities — (10.4)(30.1)
Net cash used in discontinued operations — (10.4)(30.1)
Decrease in cash and cash equivalents (87.1)(94.0)(39.9)
Cash and cash equivalents, beginning of period 282.0 376.0 415.9
Cash and cash equivalents, end of period £ 194.9 £282.0 £376.0
Supplemental disclosure of cash flow information
Cash paid during the period for interest exclusive of amounts capitalized 197.9 207.5 180.8
Income taxes paid 0.6 1.1 0.7
See accompanying notes.
Table of Contents