Virgin Media 2012 Annual Report Download - page 51
Download and view the complete annual report
Please find page 51 of the 2012 Virgin Media annual report below. You can navigate through the pages in the report by either clicking on the pages listed below, or by using the keyword search tool below to find specific information within the annual report.-
 1
1 -
2
-
3
-
4
-
5
-
6
-
7
-
8
-
9
-
10
-
11
-
12
-
13
-
14
-
15
-
16
-
17
-
18
-
19
-
20
-
21
-
22
-
23
-
24
-
25
-
26
-
27
-
28
-
29
-
30
-
31
-
32
-
33
-
34
-
35
-
36
-
37
-
38
-
39
-
40
-
 41
41 -
 42
42 -
 43
43 -
 44
44 -
 45
45 -
 46
46 -
 47
47 -
 48
48 -
 49
49 -
 50
50 -
 51
51 -
 52
52 -
 53
53 -
 54
54 -
 55
55 -
 56
56 -
 57
57 -
 58
58 -
 59
59 -
 60
60 -
 61
61 -
62
-
63
-
64
-
65
-
66
-
67
-
68
-
69
-
70
-
71
-
72
-
73
-
74
-
75
-
76
-
77
-
78
-
79
-
80
-
81
-
82
-
83
-
84
-
85
-
86
-
87
-
88
-
89
-
90
-
91
-
92
-
93
-
94
-
95
-
96
-
97
-
98
-
99
-
100
-
101
-
102
-
103
-
104
-
105
-
106
-
107
-
108
-
109
-
110
-
111
-
112
-
113
-
114
-
115
-
116
-
117
-
118
-
119
-
120
-
121
-
122
-
123
-
124
-
125
-
126
-
127
-
128
-
129
-
130
-
131
-
132
-
133
-
134
-
135
-
136
-
137
-
138
-
139
-
140
-
141
-
142
-
143
-
144
-
145
-
146
-
147
-
148
-
149
-
150
-
151
-
152
-
153
-
154
-
155
-
156
-
157
-
158
-
159
-
160
-
161
-
162
-
163
-
164
-
165
-
166
-
167
-
168
-
169
-
170
-
171
-
172
-
173
-
174
-
175
-
176
-
177
-
178
-
179
-
180
-
181
-
182
-
183
-
184
-
185
-
186
-
187
-
188
-
189
-
190
-
191
-
192
-
193
-
194
-
195
-
196
-
197
 |
 |

50
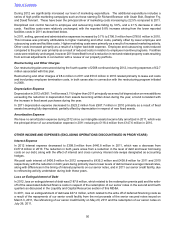
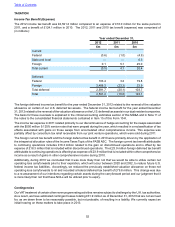
During 2012 we significantly increased our level of marketing expenditure. The additional expenditure includes a
series of high profile marketing campaigns such as those starring Sir Richard Branson with Usain Bolt, Stephen Fry,
and David Tennant. These have been the principal driver of marketing costs increasing by 22.5% compared to 2011.
Disciplined cost control has led to employee and outsourcing costs falling by 3.6%, and a 2.1% decrease in other
costs. Facilities costs were relatively unchanged, with the reported 9.8% increase arising from the lower reported
facilities costs in 2011 as described below.
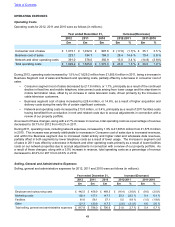
In 2011, selling, general and administrative expenses increased by 0.7% to £796.0 million from £790.6 million in 2010.
This increase was primarily attributable to higher marketing and other costs, partially offset by lower employee and
outsourcing costs and facilities costs. Higher marketing costs were primarily as a result of increased marketing activity.
Other costs increased primarily as a result of a higher bad debt expense. Employee and outsourcing costs reduced
compared to the prior year primarily as a result of reduced costs in relation to employee incentive programs. Facilities
costs were relatively unchanged, however 2011 benefited from of a reduction in rent and related property costs resulting
from accrual adjustments in connection with a review of our property portfolio.
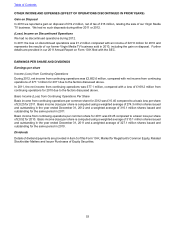
Restructuring and Other Charges
Our restructuring plan announced during the fourth quarter of 2008 continued during 2012, incurring expenses of £2.7
million associated with this plan.
Restructuring and other charges of £8.4 million in 2011 and £53.0 million in 2010 related primarily to lease exit costs
and involuntary employee termination costs, in both cases also in connection with the restructuring program initiated
in 2008.
Depreciation Expense
Depreciation in 2012 of £951.7 million was 3.1% higher than 2011 principally as a result of depreciation on new additions
exceeding the reduction in depreciation from assets becoming written down during the year, a trend consistent with
the increase in fixed asset purchases during the year.
In 2011 depreciation expense decreased to £923.2 million from £987.7 million in 2010 primarily as a result of fixed
assets becoming fully depreciated, partially offset by depreciation in respect of new fixed assets.
Amortization Expense
We have no amortization expense during 2012 since our intangible assets became fully amortized in 2011, which was
the principal driver of our amortization expense in 2011 reducing to £118.4 million from £147.6 million in 2010.
OTHER INCOME AND EXPENSES (EXCLUDING OPERATIONS DISCOUNTINUED IN PRIOR YEARS)
Interest Expense
In 2012 interest expense decreased to £398.5 million from £440.8 million in 2011, which was a decrease from
£477.8 million in 2010. The reduction in both years arose from a reduction in the level of debt and lower borrowing
costs on our debt, along with the effect of interest and cross currency interest rate swaps designated as accounting
hedges.
We paid cash interest of £406.9 million for 2012 compared to £435.2 million and £438.8 million for 2011 and 2010
respectively, with the reduction in both years being primarily due to lower levels of debt at lower average interest rates,
along with differences in the timing of interest payments on our senior notes, and in 2011 our senior credit facility, due
to refinancing activity undertaken during both these years.
Loss on Extinguishment of Debt
In 2012, loss on extinguishment of debt was £187.8 million, which related to the redemption premia paid and the write-
off of the associated deferred finance costs in respect of the redemption of our senior notes in the second and fourth
quarters as discussed in the Liquidity and Capital Resources section of this MD&A.
In 2011, loss on extinguishment of debt was £47.2 million, which related to the write off of deferred financing costs as
a result of the repayments of our senior credit facility from the net proceeds of the senior secured notes issued on
March 3, 2011, the refinancing of our senior credit facility on May 20, 2011 and the redemption of our senior notes on
July 26, 2011.
Table of Contents