Virgin Media 2012 Annual Report Download - page 102
Download and view the complete annual report
Please find page 102 of the 2012 Virgin Media annual report below. You can navigate through the pages in the report by either clicking on the pages listed below, or by using the keyword search tool below to find specific information within the annual report.-
 1
1 -
2
-
3
-
4
-
5
-
6
-
7
-
8
-
9
-
10
-
11
-
12
-
13
-
14
-
15
-
16
-
17
-
18
-
19
-
20
-
21
-
22
-
23
-
24
-
25
-
26
-
27
-
28
-
29
-
30
-
31
-
32
-
33
-
34
-
35
-
36
-
37
-
38
-
39
-
40
-
41
-
42
-
43
-
44
-
45
-
46
-
47
-
48
-
49
-
50
-
51
-
52
-
53
-
54
-
55
-
56
-
57
-
58
-
59
-
60
-
61
-
62
-
63
-
64
-
65
-
66
-
67
-
68
-
69
-
70
-
71
-
72
-
73
-
74
-
75
-
76
-
77
-
78
-
79
-
80
-
81
-
82
-
83
-
84
-
85
-
86
-
87
-
88
-
89
-
90
-
91
-
 92
92 -
 93
93 -
 94
94 -
 95
95 -
 96
96 -
 97
97 -
 98
98 -
 99
99 -
 100
100 -
 101
101 -
 102
102 -
 103
103 -
 104
104 -
 105
105 -
 106
106 -
 107
107 -
 108
108 -
 109
109 -
 110
110 -
 111
111 -
 112
112 -
113
-
114
-
115
-
116
-
117
-
118
-
119
-
120
-
121
-
122
-
123
-
124
-
125
-
126
-
127
-
128
-
129
-
130
-
131
-
132
-
133
-
134
-
135
-
136
-
137
-
138
-
139
-
140
-
141
-
142
-
143
-
144
-
145
-
146
-
147
-
148
-
149
-
150
-
151
-
152
-
153
-
154
-
155
-
156
-
157
-
158
-
159
-
160
-
161
-
162
-
163
-
164
-
165
-
166
-
167
-
168
-
169
-
170
-
171
-
172
-
173
-
174
-
175
-
176
-
177
-
178
-
179
-
180
-
181
-
182
-
183
-
184
-
185
-
186
-
187
-
188
-
189
-
190
-
191
-
192
-
193
-
194
-
195
-
196
-
197
 |
 |

F-31
posted at the date of grant having a term equal to the expected life of the option. An increase in the risk-free rates will
increase compensation cost.
Expected dividend yield. This is the annual rate of dividends per share over the exercise price of the option. An increase
in the dividend yield will increase compensation cost.
Expected volatility. Actual historical changes in the market value of our stock are used to calculate the volatility
assumption. We calculate daily market value changes over the most recent historical period as of the date of grant
equal to the expected life of the option. An increase in the expected volatility will increase compensation cost.
Expected lives. This is the period of time over which the granted options are expected to remain outstanding, and the
period over which restricted stock units and performance shares will vest. For stock option grants, this assumption is
based on actual stock option exercises. For restricted stock units and performance share grants, this assumption is
based on the stated performance period. An increase in the expected lives will increase compensation cost.
Expected volatility of selected comparator group shares. Actual historical changes in the market values of the selected
comparator group stocks are used to calculate the volatility assumption. We calculate daily market value changes over
the most recent historical period as of the date of grant equal to the expected term of the award. An increase in the
expected volatility will decrease compensation cost.
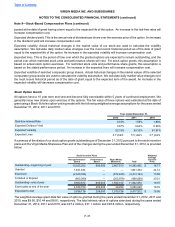
Stock Option Grants
All options have a 10 year term and vest and become fully exercisable within 5 years of continued employment. We
generally issue new shares upon exercise of the options. The fair value of these options was estimated at the date of
grant using a Black-Scholes option-pricing model with the following weighted-average assumptions for the years ended
December 31, 2012, 2011 and 2010:
Year ended December 31,
2012 2011 2010
Risk-free Interest Rate 0.72% 1.59% 1.89%
Expected Dividend Yield 0.67% 0.64% 0.90%
Expected Volatility 52.19% 59.10% 61.81%
Expected Lives 4.7 years 5.0 years 4.7 years
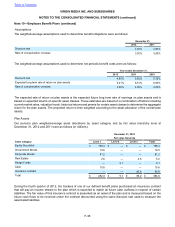
A summary of the status of our stock option grants outstanding as of December 31, 2012 pursuant to the stock incentive
plans and the Virgin Media Sharesave Plan and of the changes during the year ended December 31, 2012, is provided
below:
Stock Incentive Plans Weighted
Average
Exercise
Price Non-performance
Based Performance
Based Virgin Media
Sharesave Total
Outstanding—beginning of year 10,925,292 690,000 2,667,510 14,282,802 $ 16.71
Granted 1,841,434 — — 1,841,434 24.12
Exercised (2,540,764) — (872,429) (3,413,193) 13.65
Forfeited or Expired (665,090) — (202,979) (868,069) 20.21
Outstanding—end of year 9,560,872 690,000 1,592,102 11,842,974 18.75
Exercisable at end of the year 4,538,759 482,000 29,290 5,050,049 18.76
Expected to vest 3,836,176 208,000 1,373,736 5,417,912 $ 18.06
The weighted-average grant-date fair value of options granted during the years ended December 31, 2012, 2011 and
2010, was $9.95, $10.44 and $8.81, respectively. The total intrinsic value of options exercised during the years ended
December 31, 2012, 2011 and 2010, was £27.2 million, £31.1 million and £20.6 million, respectively.
Table of Contents
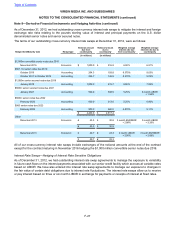
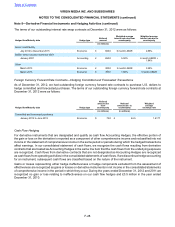
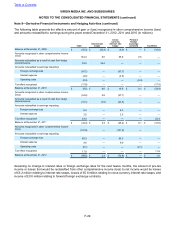
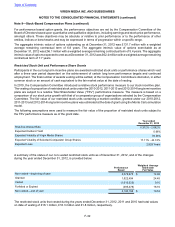
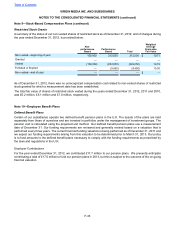
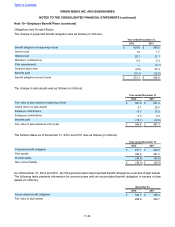
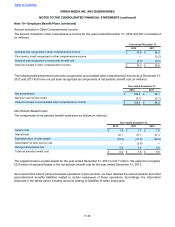
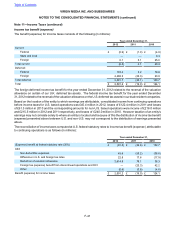
VIRGIN MEDIA INC. AND SUBSIDIARIES
NOTES TO THE CONSOLIDATED FINANCIAL STATEMENTS (continued)
Note 9—Stock-Based Compensation Plans (continued)