Virgin Media 2012 Annual Report Download - page 128
Download and view the complete annual report
Please find page 128 of the 2012 Virgin Media annual report below. You can navigate through the pages in the report by either clicking on the pages listed below, or by using the keyword search tool below to find specific information within the annual report.-
 1
1 -
2
-
3
-
4
-
5
-
6
-
7
-
8
-
9
-
10
-
11
-
12
-
13
-
14
-
15
-
16
-
17
-
18
-
19
-
20
-
21
-
22
-
23
-
24
-
25
-
26
-
27
-
28
-
29
-
30
-
31
-
32
-
33
-
34
-
35
-
36
-
37
-
38
-
39
-
40
-
41
-
42
-
43
-
44
-
45
-
46
-
47
-
48
-
49
-
50
-
51
-
52
-
53
-
54
-
55
-
56
-
57
-
58
-
59
-
60
-
61
-
62
-
63
-
64
-
65
-
66
-
67
-
68
-
69
-
70
-
71
-
72
-
73
-
74
-
75
-
76
-
77
-
78
-
79
-
80
-
81
-
82
-
83
-
84
-
85
-
86
-
87
-
88
-
89
-
90
-
91
-
92
-
93
-
94
-
95
-
96
-
97
-
98
-
99
-
100
-
101
-
102
-
103
-
104
-
105
-
106
-
107
-
108
-
109
-
110
-
111
-
112
-
113
-
114
-
115
-
116
-
117
-
 118
118 -
 119
119 -
 120
120 -
 121
121 -
 122
122 -
 123
123 -
 124
124 -
 125
125 -
 126
126 -
 127
127 -
 128
128 -
 129
129 -
 130
130 -
 131
131 -
 132
132 -
 133
133 -
 134
134 -
 135
135 -
 136
136 -
 137
137 -
 138
138 -
139
-
140
-
141
-
142
-
143
-
144
-
145
-
146
-
147
-
148
-
149
-
150
-
151
-
152
-
153
-
154
-
155
-
156
-
157
-
158
-
159
-
160
-
161
-
162
-
163
-
164
-
165
-
166
-
167
-
168
-
169
-
170
-
171
-
172
-
173
-
174
-
175
-
176
-
177
-
178
-
179
-
180
-
181
-
182
-
183
-
184
-
185
-
186
-
187
-
188
-
189
-
190
-
191
-
192
-
193
-
194
-
195
-
196
-
197
 |
 |
F-57
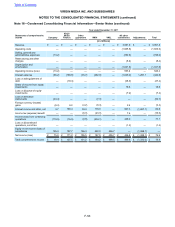
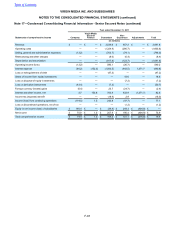
Year ended December 31, 2010
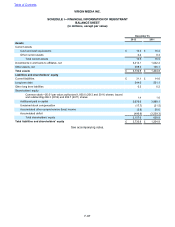
Statements of cash flows Company
Virgin
Media
Finance Other
guarantors VMIH VMIL All other
subsidiaries Adjustments Total
(in millions)
Net cash provided by (used
in) operating activities £ (34.5) £ 5.4 £ 6.8 £(10.9) £ — £ 1,070.8 £ — £ 1,037.6
Investing activities:
Purchase of fixed and
intangible assets — — — — — (628.4) — (628.4)
Proceeds from sale of fixed
assets —————36.0 —36.0
Principal repayments on
loans to equity investments — — — — — 8.4 — 8.4
Principal drawdowns
(repayments) on loans to
group companies 479.9 173.7 (6.7) 1,556.1 — (2,203.0) — —
Disposal of businesses, net — ————167.4 —167.4
Other — — — — — 5.2 — 5.2
Net cash (used in) provided
by investing activities 479.9 173.7 (6.7) 1,556.1 — (2,614.4) — (411.4)
Financing activities:
New borrowings, net of
financing fees ———(71.0) — 3,143.0 — 3,072.0
Repurchase of common stock (161.5) — — — — — — (161.5)
Purchase of conversion
hedges (205.4) — — — — — — (205.4)
Proceeds from employee
stock option exercises 17.0 — — — — — — 17.0
Principal payments on long
term debt and capital leases — (179.2) — (1,726.9) — (1,333.7) — (3,239.8)
Intercompany funding
movements 22.8 — — (35.7) — 12.9 — —
Dividends paid (34.1) — — — — — — (34.1)
Net cash (used in) provided
by financing activities (361.2) (179.2) — (1,833.6) — 1,822.2 — (551.8)
Cash flow from
discontinued operations:
Net cash used in operating
activities —————(30.1) — (30.1)
Net cash used in
discontinued operations —————(30.1) — (30.1)
Effect of exchange rates on
cash and cash equivalents 4.7 — — — — — — 4.7
Increase (decrease) in cash
and cash equivalents 88.9 (0.1)0.1 (288.4) — 248.5 —49.0
Cash and cash equivalents at
beginning of period 12.4 1.9 0.3 292.9 —123.0 —430.5
Cash and cash equivalents at
end of period £ 101.3 £ 1.8 £ 0.4 £ 4.5 £ — £ 371.5 £ — £ 479.5
Table of Contents
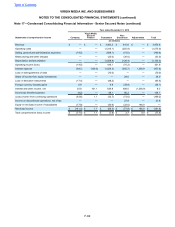
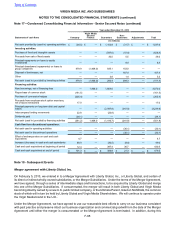
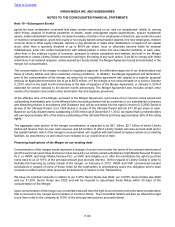
VIRGIN MEDIA INC. AND SUBSIDIARIES
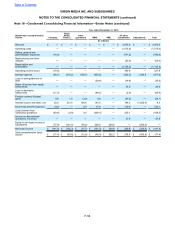
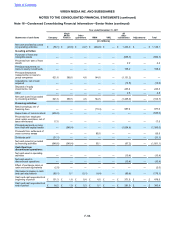
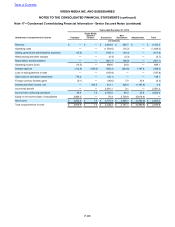
NOTES TO THE CONSOLIDATED FINANCIAL STATEMENTS (continued)
Note 16—Condensed Consolidating Financial Information—Senior Notes (continued)