Virgin Media 2012 Annual Report Download - page 145
Download and view the complete annual report
Please find page 145 of the 2012 Virgin Media annual report below. You can navigate through the pages in the report by either clicking on the pages listed below, or by using the keyword search tool below to find specific information within the annual report.-
 1
1 -
2
-
3
-
4
-
5
-
6
-
7
-
8
-
9
-
10
-
11
-
12
-
13
-
14
-
15
-
16
-
17
-
18
-
19
-
20
-
21
-
22
-
23
-
24
-
25
-
26
-
27
-
28
-
29
-
30
-
31
-
32
-
33
-
34
-
35
-
36
-
37
-
38
-
39
-
40
-
41
-
42
-
43
-
44
-
45
-
46
-
47
-
48
-
49
-
50
-
51
-
52
-
53
-
54
-
55
-
56
-
57
-
58
-
59
-
60
-
61
-
62
-
63
-
64
-
65
-
66
-
67
-
68
-
69
-
70
-
71
-
72
-
73
-
74
-
75
-
76
-
77
-
78
-
79
-
80
-
81
-
82
-
83
-
84
-
85
-
86
-
87
-
88
-
89
-
90
-
91
-
92
-
93
-
94
-
95
-
96
-
97
-
98
-
99
-
100
-
101
-
102
-
103
-
104
-
105
-
106
-
107
-
108
-
109
-
110
-
111
-
112
-
113
-
114
-
115
-
116
-
117
-
118
-
119
-
120
-
121
-
122
-
123
-
124
-
125
-
126
-
127
-
128
-
129
-
130
-
131
-
132
-
133
-
134
-
 135
135 -
 136
136 -
 137
137 -
 138
138 -
 139
139 -
 140
140 -
 141
141 -
 142
142 -
 143
143 -
 144
144 -
 145
145 -
 146
146 -
 147
147 -
 148
148 -
 149
149 -
 150
150 -
 151
151 -
 152
152 -
 153
153 -
 154
154 -
 155
155 -
156
-
157
-
158
-
159
-
160
-
161
-
162
-
163
-
164
-
165
-
166
-
167
-
168
-
169
-
170
-
171
-
172
-
173
-
174
-
175
-
176
-
177
-
178
-
179
-
180
-
181
-
182
-
183
-
184
-
185
-
186
-
187
-
188
-
189
-
190
-
191
-
192
-
193
-
194
-
195
-
196
-
197
 |
 |

F-74
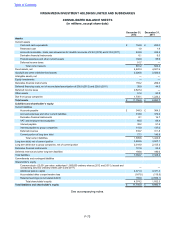
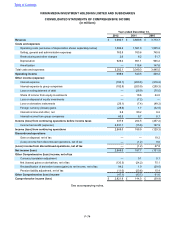
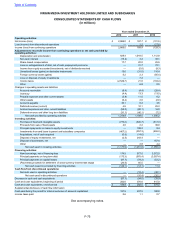
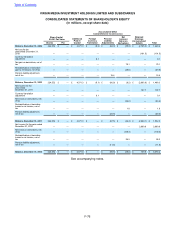
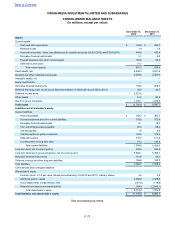
VIRGIN MEDIA INVESTMENT HOLDINGS LIMITED AND SUBSIDIARIES
CONSOLIDATED STATEMENTS OF COMPREHENSIVE INCOME
(in millions)
Year ended December 31,
2012 2011 2010
Revenue £ 3,980.7 £ 3,889.8 £ 3,773.7
Costs and expenses
Operating costs (exclusive of depreciation shown separately below) 1,586.2 1,561.0 1,535.2
Selling, general and administrative expenses 763.9 760.6 745.8
Restructuring and other charges 2.6 8.2 51.7
Depreciation 929.4 901.1 965.2
Amortization — 118.4 147.6
Total costs and expenses 3,282.1 3,349.3 3,445.5
Operating income 698.6 540.5 328.2
Other income (expense)
Interest expense (190.1) (200.8) (216.2)
Interest expense to group companies (182.9) (200.9) (259.3)
Loss on extinguishment of debt — (28.9) (70.0)
Share of income from equity investments — 18.6 24.0
Loss on disposal of equity investments — (7.2) —
Loss on derivative instruments (26.1) (7.4) (48.2)
Foreign currency (losses) gains (28.9) 1.7 (32.6)
Interest income and other, net 6.8 80.2 8.2
Interest income from group companies 60.5 8.7 8.7
Income (loss) from continuing operations before income taxes 337.9 204.5 (257.2)
Income tax benefit (expense) 2,531.1 (15.6) 127.9
Income (loss) from continuing operations 2,869.0 188.9 (129.3)
Discontinued operations
Gain on disposal, net of tax — — 19.2
(Loss) income from discontinued operations, net of tax — (1.2) 8.6
(Loss) income from discontinued operations, net of tax — (1.2) 27.8
Net income (loss) 2,869.0 187.7 (101.5)
Other Comprehensive (loss) income, net of tax
Currency translation adjustment — 0.1 0.1
Net (losses) gains on derivatives, net of tax (130.3) (24.2) 75.1
Reclassification of derivative losses (gains) to net income, net of tax 94.2 1.0 (29.0)
Pension liability adjustment, net of tax (11.0) (20.6) 15.4
Other Comprehensive (loss) income (47.1) (43.7) 61.6
Comprehensive income (loss) £ 2,821.9 £ 144.0 £ (39.9)
See accompanying notes.
Table of Contents