Virgin Media 2012 Annual Report Download - page 37
Download and view the complete annual report
Please find page 37 of the 2012 Virgin Media annual report below. You can navigate through the pages in the report by either clicking on the pages listed below, or by using the keyword search tool below to find specific information within the annual report.-
 1
1 -
2
-
3
-
4
-
5
-
6
-
7
-
8
-
9
-
10
-
11
-
12
-
13
-
14
-
15
-
16
-
17
-
18
-
19
-
20
-
21
-
22
-
23
-
24
-
25
-
26
-
 27
27 -
 28
28 -
 29
29 -
 30
30 -
 31
31 -
 32
32 -
 33
33 -
 34
34 -
 35
35 -
 36
36 -
 37
37 -
 38
38 -
 39
39 -
 40
40 -
 41
41 -
 42
42 -
 43
43 -
 44
44 -
 45
45 -
 46
46 -
 47
47 -
48
-
49
-
50
-
51
-
52
-
53
-
54
-
55
-
56
-
57
-
58
-
59
-
60
-
61
-
62
-
63
-
64
-
65
-
66
-
67
-
68
-
69
-
70
-
71
-
72
-
73
-
74
-
75
-
76
-
77
-
78
-
79
-
80
-
81
-
82
-
83
-
84
-
85
-
86
-
87
-
88
-
89
-
90
-
91
-
92
-
93
-
94
-
95
-
96
-
97
-
98
-
99
-
100
-
101
-
102
-
103
-
104
-
105
-
106
-
107
-
108
-
109
-
110
-
111
-
112
-
113
-
114
-
115
-
116
-
117
-
118
-
119
-
120
-
121
-
122
-
123
-
124
-
125
-
126
-
127
-
128
-
129
-
130
-
131
-
132
-
133
-
134
-
135
-
136
-
137
-
138
-
139
-
140
-
141
-
142
-
143
-
144
-
145
-
146
-
147
-
148
-
149
-
150
-
151
-
152
-
153
-
154
-
155
-
156
-
157
-
158
-
159
-
160
-
161
-
162
-
163
-
164
-
165
-
166
-
167
-
168
-
169
-
170
-
171
-
172
-
173
-
174
-
175
-
176
-
177
-
178
-
179
-
180
-
181
-
182
-
183
-
184
-
185
-
186
-
187
-
188
-
189
-
190
-
191
-
192
-
193
-
194
-
195
-
196
-
197
 |
 |
36
UK for the first time. Therefore, as required by the applicable accounting rules, we have reduced the valuation allowance,
which has resulted in a non-cash income tax benefit of £2,592.3 million.
LIQUIDITY AND CAPITAL RESOURCES
Cashflow
Receipts from customers in our Consumer segment together with receipts from our Business customers continue to
be our principal source of cash, and we expect this to continue. Net cash from operating activities decreased by 9.5%
in 2012 to £1,039.7 million, compared to £1,149.1 million and £1,037.6 million in 2011 and 2010 respectively.
During the year we invested an additional £101.5 million of cash in upgrading our customer's broadband speeds, which
contributed to our total purchase of fixed assets increasing to £783.2 million for the year, compared to £656.7 million
in 2011, and £628.4 million in 2010.
During 2012, we paid cash interest of £406.9 million on our borrowings, which was 6.5% lower than the £435.2 million
interest paid in 2011, and 7.3% lower than the £438.8 million interest paid in 2010, with both decreases being principally
due to lower interest rates on lower levels of debt following the refinancings discussed below.
Cash remaining from our operating and investing activities has been used, as described below, to improve the maturity
and interest profile of our long term debt, and to continue our capital return programs.
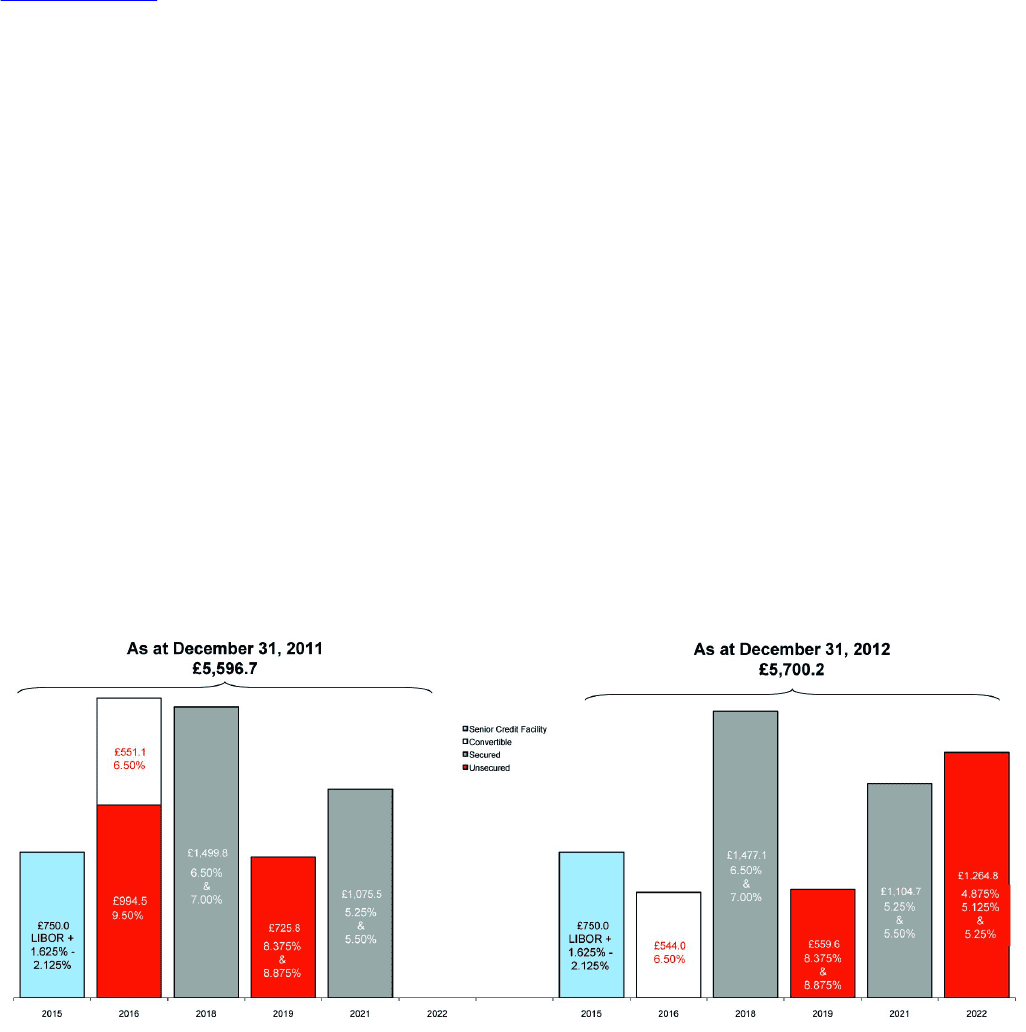
Long Term Debt
During 2012, we have used our strong cash position to access advantageous markets and refinance our debt, reducing
interest expense and extending debt maturities. Since announcing our first phase capital optimization program on
July 27, 2010, we have refinanced a total of £2.2 billion of debt, as illustrated by the chart below which shows the
carrying value and principal interest rate of our long term debt instruments (in millions, by date of maturity).
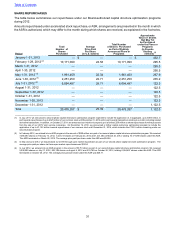
Capital returns
We remain committed to a long term program of returning cash to shareholders. Since we began our capital return
program in July 2010, we have repurchased 73 million shares of common stock for £1,127 million, which is approximately
22% of our share count at July 2010. We purchased 52.5 million shares during the first and second phases of our
program in 2011 and 2010 at an average purchase price of $24.35. The second phase of our program announced on
July 27, 2011 continued during 2012 with the purchase and cancellation of a further 20.5 million shares during the
year at an average purchase price of $25.39. With the near completion of our second phase program, we announced
on December 14, 2012, a third phase to our share buyback program of at least £1,122.5 million to be completed before
the end of 2014, which includes £122.5 million remaining under our second phase program. This £1,122.5 million
represents approximately 19% of our market capitalization at December 14, 2012. Under the terms of the Merger
Agreement we signed with Liberty Global on February 5, 2013, we have suspended our capital returns program pending
consummation of the merger. If the merger is not consummated we intend to resume our capital returns program.
We have maintained our quarterly dividend at $0.04 per share for the first three quarters of 2012, and on February 5,
2013 our board approved the payment of a $0.04 dividend for the three months ended December 31, 2012. Under
the terms of the Merger Agreement we signed with Liberty Global on February 5, 2013, we are permitted to continue
to pay a dividend of up to $0.04 per quarter.
Table of Contents