Virgin Media 2012 Annual Report Download - page 35
Download and view the complete annual report
Please find page 35 of the 2012 Virgin Media annual report below. You can navigate through the pages in the report by either clicking on the pages listed below, or by using the keyword search tool below to find specific information within the annual report.-
 1
1 -
2
-
3
-
4
-
5
-
6
-
7
-
8
-
9
-
10
-
11
-
12
-
13
-
14
-
15
-
16
-
17
-
18
-
19
-
20
-
21
-
22
-
23
-
24
-
 25
25 -
 26
26 -
 27
27 -
 28
28 -
 29
29 -
 30
30 -
 31
31 -
 32
32 -
 33
33 -
 34
34 -
 35
35 -
 36
36 -
 37
37 -
 38
38 -
 39
39 -
 40
40 -
 41
41 -
 42
42 -
 43
43 -
 44
44 -
 45
45 -
46
-
47
-
48
-
49
-
50
-
51
-
52
-
53
-
54
-
55
-
56
-
57
-
58
-
59
-
60
-
61
-
62
-
63
-
64
-
65
-
66
-
67
-
68
-
69
-
70
-
71
-
72
-
73
-
74
-
75
-
76
-
77
-
78
-
79
-
80
-
81
-
82
-
83
-
84
-
85
-
86
-
87
-
88
-
89
-
90
-
91
-
92
-
93
-
94
-
95
-
96
-
97
-
98
-
99
-
100
-
101
-
102
-
103
-
104
-
105
-
106
-
107
-
108
-
109
-
110
-
111
-
112
-
113
-
114
-
115
-
116
-
117
-
118
-
119
-
120
-
121
-
122
-
123
-
124
-
125
-
126
-
127
-
128
-
129
-
130
-
131
-
132
-
133
-
134
-
135
-
136
-
137
-
138
-
139
-
140
-
141
-
142
-
143
-
144
-
145
-
146
-
147
-
148
-
149
-
150
-
151
-
152
-
153
-
154
-
155
-
156
-
157
-
158
-
159
-
160
-
161
-
162
-
163
-
164
-
165
-
166
-
167
-
168
-
169
-
170
-
171
-
172
-
173
-
174
-
175
-
176
-
177
-
178
-
179
-
180
-
181
-
182
-
183
-
184
-
185
-
186
-
187
-
188
-
189
-
190
-
191
-
192
-
193
-
194
-
195
-
196
-
197
 |
 |
34
ITEM 7. MANAGEMENT’S DISCUSSION AND ANALYSIS OF FINANCIAL CONDITION AND RESULTS
OF OPERATIONS
INTRODUCTION
Management's Discussion and Analysis of Financial Condition and Results of Operations, or MD&A, is provided to
assist readers in understanding our recent developments, results of operations, financial condition and cash flows.
Our MD&A should be read in conjunction with the description of our business provided in Item 1, the risk factors
affecting us set out in Item 1A, and our financial statements and related notes within Item 8 of this Form 10-K.
Throughout our MD&A, references to 2012, 2011, and 2010 are to the financial years ending December 31, 2012,
2011 and 2010 respectively. We also refer to the year ended December 31, 2012 as the year or the current year.
Our MD&A is organized as follows:
• Overview: Analysis of recent developments in our business together with a summary of overall performance,
provided up-front to give context to the remainder of our MD&A.
• Critical accounting estimates: A summary of the critical accounting estimates and subjective interpretations of
accounting principles which impact our reported results of operations and financial condition.
• Consolidated results of operations: Discussion and analysis of our results of operations, comparing 2012, 2011
and 2010. We present factors impacting our Consumer and Business segments, our Network costs, and other
significant components of our results of operations.
• Liquidity and capital resources: Discussion and analysis of our financial condition, cash flows and liquidity,
comparing 2012, 2011, and 2010. This section includes discussion of the fair values of our financial instruments,
contractual obligations, and off-balance sheet arrangements.
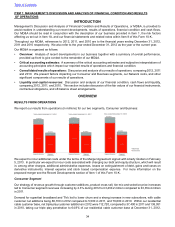
OVERVIEW
RESULTS FROM OPERATIONS
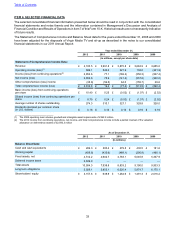
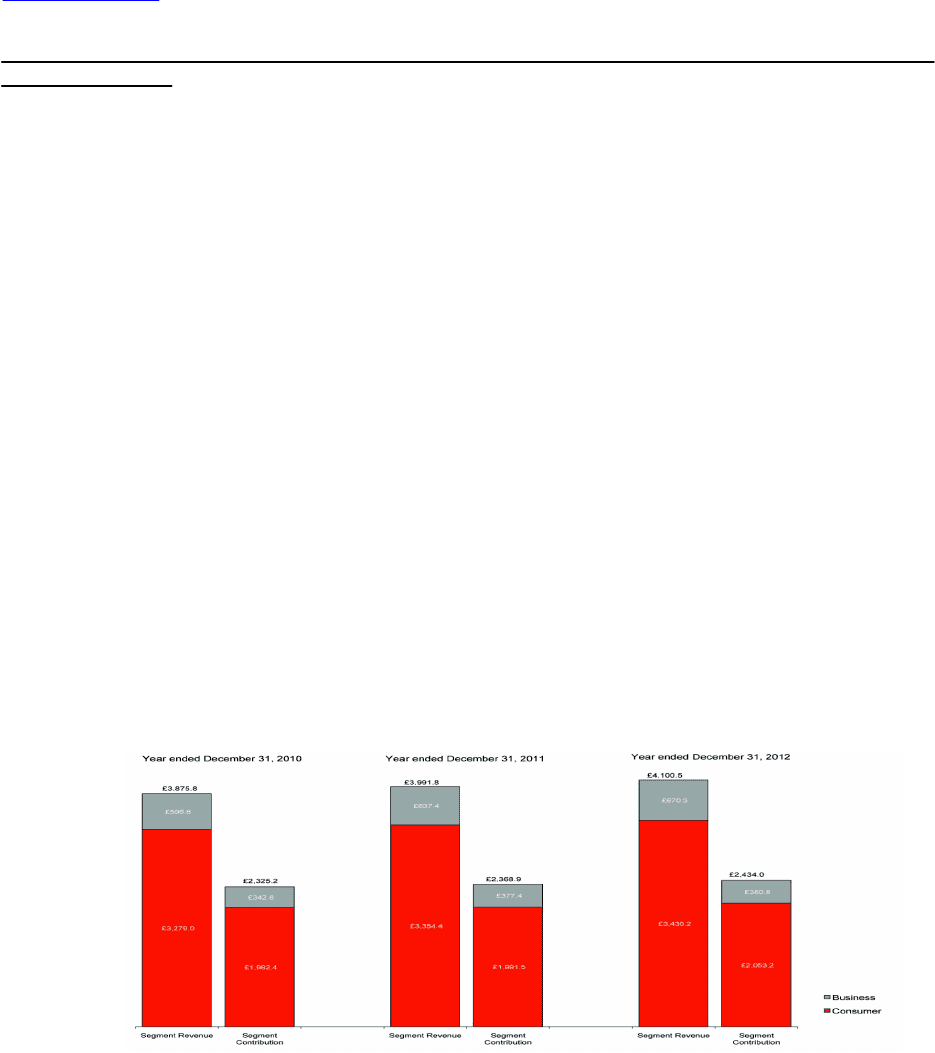
We report our results from operations (in millions) for our two segments, Consumer and Business:
We expect to incur additional costs under the terms of the Merger Agreement signed with Liberty Global on February
5, 2013. In particular we expect to incur costs associated with changing our debt and equity structure, which will result
in, among other charges, additional administrative expenses, losses on extinguishment of debt, gains and losses on
derivative instruments, interest expense and stock based compensation expense. For more information on the
proposed merger see the Recent Developments section of Item 1 of this Form 10-K.
Consumer Segment
Our strategy of revenue growth through customer additions, product cross sell, tier mix and selective price increases
led to Consumer segment revenues increasing by 2.3% during 2012 to £3,430.2 million compared to £3,354.4 million
in 2011.
Demand for superfast broadband and TiVo led to lower churn and a strong increase in new subscribers, with cable
customer net additions being 88,700 in 2012 compared to 5,500 in 2011, and 76,600 in 2010. Within our residential
cable customer base, net triple play customer additions in 2012 were 112,720, compared to 37,400 in 2011 and 138,051
in 2010, taking our triple play penetration to 64.9% of our residential cable customer base at December 31, 2012.
Table of Contents