Virgin Media 2012 Annual Report Download - page 64
Download and view the complete annual report
Please find page 64 of the 2012 Virgin Media annual report below. You can navigate through the pages in the report by either clicking on the pages listed below, or by using the keyword search tool below to find specific information within the annual report.-
 1
1 -
2
-
3
-
4
-
5
-
6
-
7
-
8
-
9
-
10
-
11
-
12
-
13
-
14
-
15
-
16
-
17
-
18
-
19
-
20
-
21
-
22
-
23
-
24
-
25
-
26
-
27
-
28
-
29
-
30
-
31
-
32
-
33
-
34
-
35
-
36
-
37
-
38
-
39
-
40
-
41
-
42
-
43
-
44
-
45
-
46
-
47
-
48
-
49
-
50
-
51
-
52
-
53
-
 54
54 -
 55
55 -
 56
56 -
 57
57 -
 58
58 -
 59
59 -
 60
60 -
 61
61 -
 62
62 -
 63
63 -
 64
64 -
 65
65 -
 66
66 -
 67
67 -
 68
68 -
 69
69 -
 70
70 -
 71
71 -
 72
72 -
 73
73 -
 74
74 -
75
-
76
-
77
-
78
-
79
-
80
-
81
-
82
-
83
-
84
-
85
-
86
-
87
-
88
-
89
-
90
-
91
-
92
-
93
-
94
-
95
-
96
-
97
-
98
-
99
-
100
-
101
-
102
-
103
-
104
-
105
-
106
-
107
-
108
-
109
-
110
-
111
-
112
-
113
-
114
-
115
-
116
-
117
-
118
-
119
-
120
-
121
-
122
-
123
-
124
-
125
-
126
-
127
-
128
-
129
-
130
-
131
-
132
-
133
-
134
-
135
-
136
-
137
-
138
-
139
-
140
-
141
-
142
-
143
-
144
-
145
-
146
-
147
-
148
-
149
-
150
-
151
-
152
-
153
-
154
-
155
-
156
-
157
-
158
-
159
-
160
-
161
-
162
-
163
-
164
-
165
-
166
-
167
-
168
-
169
-
170
-
171
-
172
-
173
-
174
-
175
-
176
-
177
-
178
-
179
-
180
-
181
-
182
-
183
-
184
-
185
-
186
-
187
-
188
-
189
-
190
-
191
-
192
-
193
-
194
-
195
-
196
-
197
 |
 |
63
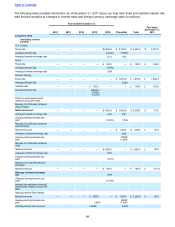
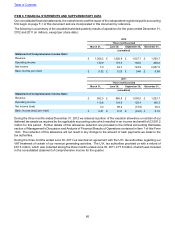
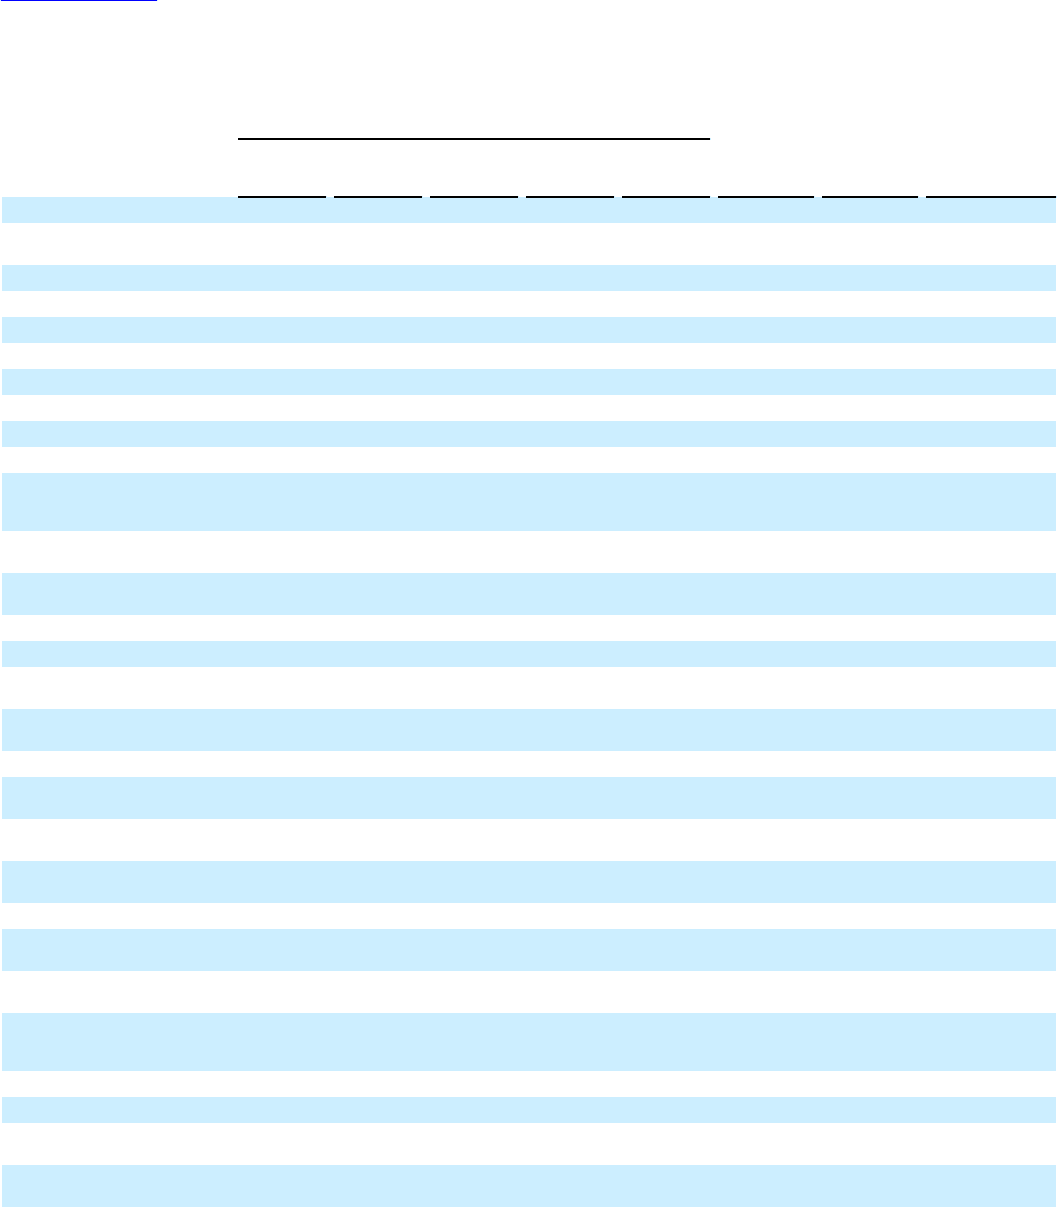
The following table provides information as of December 31, 2012 about our long term fixed and variable interest rate
debt that are sensitive to changes in interest rates and foreign currency exchange rates (in millions):
Year ended December 31,
2013 2014 2015 2016 2017 Thereafter Total
Fair Value
December 31,
2012
Long term debt
(including current
portion)
U.S. Dollars
Fixed rate — — — $ 1,000.0 $ — $ 3,407.1 $ 4,407.1 £5,737.4
Average interest rate 6.50%5.983%
Average forward exchange rate 0.63 0.62
Pounds Sterling
Fixed rate — — — — — £ 2,178.5 £ 2,178.5 £2,367.4
Average interest rate 6.40%
Variable rate — — £ 750.0 £ — — — £ 750.0 £ 750.0
Average interest rate LIBOR +
1.625%-
2.125%
Currency swap agreements
related to long term debt
Receipt of U.S.Dollars (interest
and principal)
Notional amount — — — — — $ 2,900.0 $ 2,900.0 £ (62.1)
Average forward exchange rate 0.62
Average sterling interest rate
paid 6.55%
Receipt of U.S.Dollars (interest
and principal)
Notional amount — — — — — $ 500.0 $500.0 £ 36.3
Average contract exchange
rate 0.62
Average sterling interest rate
paid LIBOR
+1.94%
Receipt of U.S.Dollars (interest
only)
Notional amount — — — $ 1,000.0 — — $ 1,000.0 £ 16.6
Average contract exchange
rate 0.52
Average sterling interest rate
paid 6.91%
Interest rate derivative
financial instruments related
to long term debt
Sterling Interest Rate Swaps
Notional amount — — £ 600.0 — — £ 650.0 £1,250.0 £ 66.4
Average sterling interest rate
paid 2.86% LIBOR
+1.84%
Sterling interest rate received LIBOR 5.50%
Table of Contents