Virgin Media 2012 Annual Report Download - page 48
Download and view the complete annual report
Please find page 48 of the 2012 Virgin Media annual report below. You can navigate through the pages in the report by either clicking on the pages listed below, or by using the keyword search tool below to find specific information within the annual report.-
 1
1 -
2
-
3
-
4
-
5
-
6
-
7
-
8
-
9
-
10
-
11
-
12
-
13
-
14
-
15
-
16
-
17
-
18
-
19
-
20
-
21
-
22
-
23
-
24
-
25
-
26
-
27
-
28
-
29
-
30
-
31
-
32
-
33
-
34
-
35
-
36
-
37
-
 38
38 -
 39
39 -
 40
40 -
 41
41 -
 42
42 -
 43
43 -
 44
44 -
 45
45 -
 46
46 -
 47
47 -
 48
48 -
 49
49 -
 50
50 -
 51
51 -
 52
52 -
 53
53 -
 54
54 -
 55
55 -
 56
56 -
 57
57 -
 58
58 -
59
-
60
-
61
-
62
-
63
-
64
-
65
-
66
-
67
-
68
-
69
-
70
-
71
-
72
-
73
-
74
-
75
-
76
-
77
-
78
-
79
-
80
-
81
-
82
-
83
-
84
-
85
-
86
-
87
-
88
-
89
-
90
-
91
-
92
-
93
-
94
-
95
-
96
-
97
-
98
-
99
-
100
-
101
-
102
-
103
-
104
-
105
-
106
-
107
-
108
-
109
-
110
-
111
-
112
-
113
-
114
-
115
-
116
-
117
-
118
-
119
-
120
-
121
-
122
-
123
-
124
-
125
-
126
-
127
-
128
-
129
-
130
-
131
-
132
-
133
-
134
-
135
-
136
-
137
-
138
-
139
-
140
-
141
-
142
-
143
-
144
-
145
-
146
-
147
-
148
-
149
-
150
-
151
-
152
-
153
-
154
-
155
-
156
-
157
-
158
-
159
-
160
-
161
-
162
-
163
-
164
-
165
-
166
-
167
-
168
-
169
-
170
-
171
-
172
-
173
-
174
-
175
-
176
-
177
-
178
-
179
-
180
-
181
-
182
-
183
-
184
-
185
-
186
-
187
-
188
-
189
-
190
-
191
-
192
-
193
-
194
-
195
-
196
-
197
 |
 |

47
Business Segment
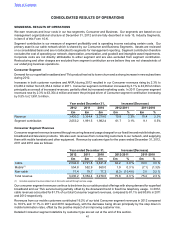
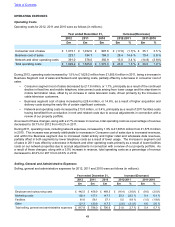
Our Business segment continues to be a key driver of overall revenue growth. Demand for data across both retail
and wholesale markets continues to drive the increase in Business segment revenues, although this increase is partially
offset by the continued decline in voice revenues in both markets. As a result, total revenues from our business
segment increased by 5.2% during 2012 to £670.3 million compared to £637.4 million in 2011 and £596.8 million in
2010.
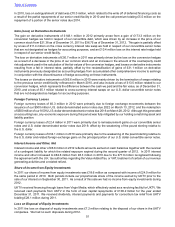
The Business segment results for 2012, 2011 and 2010 were as follows (in millions):
Year ended December 31, Increase/(Decrease)
2012 2011 2010 2012-2011 2011-2010
£m £m £m £m % £m %
Revenue 670.3 637.4 596.8 32.9 5.2% 40.6 6.8%
Segment Contribution 380.8 377.4 342.8 3.4 0.9% 34.6 10.1%
Business Segment Revenue
Business segment revenue is earned through recurring fees and usage charges from retail and wholesale customers,
which comprises revenue from, data and internet services, transmission, inbound and outbound voice, and rental of
fibers. We also earn revenues from installing equipment and connecting customers to our network.
Business segment revenue is inherently subject to quarter-on-quarter and year-on-year fluctuations due to the uneven
way we earn revenue from significant contracts.
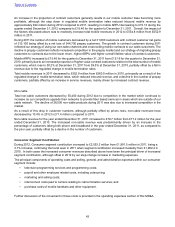
Our strategy to grow business data revenues has continued through 2012 with revenue from business customers
increasing by 5.2% to £670.3 million from £637.4 million for 2011, driven primarily by an increase in retail and wholesale
data revenues, partially offset by a decrease in LAN solutions and retail voice revenues. Data revenue growth was
driven by strong revenues from supplying mobile backhaul solutions and major public sector contracts, supported by
an increase in retail volumes across key IPVPN and Ethernet products.
During 2011, a 6.8% increase over revenues of £596.8 million for 2010 was primarily attributable to growth in retail
and wholesale data and LAN solutions revenues, partially offset by a fall in retail and wholesale voice revenues.
In 2012 total data revenues accounted for 70.8% of total business revenues, compared to 67.5% and 63.5% in 2011
and 2010 respectively.
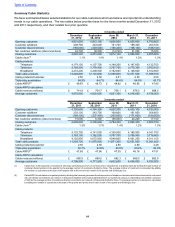
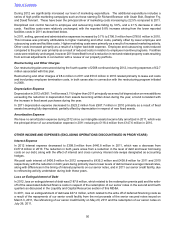
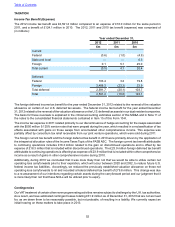
The Business segment revenue results for 2012, 2011 and 2010 were as follows (in millions):
Year ended December 31, Increase/(Decrease)
2012 2011 2010 2012-2011 2011-2010
£m £m £m £m % £m %
Retail:
Data 307.2 277.0 241.5 30.2 10.9 % 35.5 14.7 %
Voice 139.1 153.7 163.3 (14.6) (9.5)% (9.6) (5.9)%
LAN Solutions and Other 33.9 35.4 31.7 (1.5) (4.2)% 3.7 11.7 %
480.2 466.1 436.5 14.1 3.0 % 29.6 6.8 %
Wholesale:
Data 167.6 153.1 137.7 14.5 9.5 % 15.4 11.2 %
Voice 22.5 18.2 22.6 4.3 23.6 % (4.4) (19.5)%
190.1 171.3 160.3 18.8 11.0 % 11.0 6.9 %
Total Revenue 670.3 637.4 596.8 32.9 5.2 % 40.6 6.8 %
Table of Contents