Virgin Media 2012 Annual Report Download - page 66
Download and view the complete annual report
Please find page 66 of the 2012 Virgin Media annual report below. You can navigate through the pages in the report by either clicking on the pages listed below, or by using the keyword search tool below to find specific information within the annual report.-
 1
1 -
2
-
3
-
4
-
5
-
6
-
7
-
8
-
9
-
10
-
11
-
12
-
13
-
14
-
15
-
16
-
17
-
18
-
19
-
20
-
21
-
22
-
23
-
24
-
25
-
26
-
27
-
28
-
29
-
30
-
31
-
32
-
33
-
34
-
35
-
36
-
37
-
38
-
39
-
40
-
41
-
42
-
43
-
44
-
45
-
46
-
47
-
48
-
49
-
50
-
51
-
52
-
53
-
54
-
55
-
 56
56 -
 57
57 -
 58
58 -
 59
59 -
 60
60 -
 61
61 -
 62
62 -
 63
63 -
 64
64 -
 65
65 -
 66
66 -
 67
67 -
 68
68 -
 69
69 -
 70
70 -
 71
71 -
 72
72 -
 73
73 -
 74
74 -
 75
75 -
 76
76 -
77
-
78
-
79
-
80
-
81
-
82
-
83
-
84
-
85
-
86
-
87
-
88
-
89
-
90
-
91
-
92
-
93
-
94
-
95
-
96
-
97
-
98
-
99
-
100
-
101
-
102
-
103
-
104
-
105
-
106
-
107
-
108
-
109
-
110
-
111
-
112
-
113
-
114
-
115
-
116
-
117
-
118
-
119
-
120
-
121
-
122
-
123
-
124
-
125
-
126
-
127
-
128
-
129
-
130
-
131
-
132
-
133
-
134
-
135
-
136
-
137
-
138
-
139
-
140
-
141
-
142
-
143
-
144
-
145
-
146
-
147
-
148
-
149
-
150
-
151
-
152
-
153
-
154
-
155
-
156
-
157
-
158
-
159
-
160
-
161
-
162
-
163
-
164
-
165
-
166
-
167
-
168
-
169
-
170
-
171
-
172
-
173
-
174
-
175
-
176
-
177
-
178
-
179
-
180
-
181
-
182
-
183
-
184
-
185
-
186
-
187
-
188
-
189
-
190
-
191
-
192
-
193
-
194
-
195
-
196
-
197
 |
 |

65
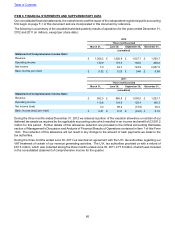
ITEM 8. FINANCIAL STATEMENTS AND SUPPLEMENTARY DATA
Our consolidated financial statements, the notes thereto and the report of the independent registered public accounting
firm begin on page F-1 of this document and are incorporated in this document by reference.
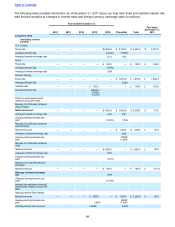
The following is a summary of the unaudited selected quarterly results of operations for the years ended December 31,
2012 and 2011 (in millions, except per share data):
2012
Three months ended
March 31, June 30, September 30, December 31,
(unaudited)
Statement of Comprehensive Income Data:
Revenue £ 1,006.2 £ 1,026.9 £ 1,027.7 £ 1,039.7
Operating income 130.9 179.6 180.0 208.6
Net income 7.0 64.7 123.9 2,657.0
Basic income per share £ 0.02 £ 0.23 £ 0.46 £ 9.88
2011
Three months ended
March 31, June 30, September 30, December 31,
(unaudited)
Statement of Comprehensive Income Data:
Revenue £ 982.3 £ 985.8 £ 1,000.0 £ 1,023.7
Operating income 110.6 134.9 128.4 166.3
Net income (loss) 3.3 98.2 (73.8) 48.2
Basic income (loss) per share £ 0.01 £ 0.31 £ (0.24) £ 0.16
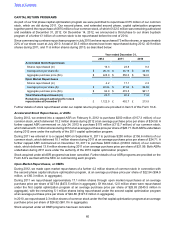
During the three months ended December 31. 2012 we reduced a portion of the valuation allowance on certain of our
deferred tax assets as required by the applicable accounting rules which resulted in an income tax benefit of £2,591.2
million for this period. Further details of this allowance reduction are provided in the Critical Accounting Estimates
section of Management's Discussion and Analysis of Financial Results of Operations contained in Item 7 of this Form
10-K. The reduction of this allowance will not result in any change to the amount of cash payments we make to the
tax authorities.
During the three months ended June 30, 2011 we reached an agreement with the U.K. tax authorities regarding our
VAT treatment of certain of our revenue generating activities. The U.K. tax authorities provided us with a refund of
£81.5 million, which was collected during the three months ended June 30, 2011, £77.6 million of which was included
in the consolidated statement of comprehensive income for the quarter.
Table of Contents