Virgin Media 2012 Annual Report Download - page 126
Download and view the complete annual report
Please find page 126 of the 2012 Virgin Media annual report below. You can navigate through the pages in the report by either clicking on the pages listed below, or by using the keyword search tool below to find specific information within the annual report.-
 1
1 -
 2
2 -
 3
3 -
 4
4 -
 5
5 -
 6
6 -
 7
7 -
 8
8 -
 9
9 -
 10
10 -
 11
11 -
 12
12 -
 13
13 -
 14
14 -
 15
15 -
 16
16 -
 17
17 -
 18
18 -
 19
19 -
 20
20 -
 21
21 -
 22
22 -
 23
23 -
 24
24 -
 25
25 -
 26
26 -
 27
27 -
 28
28 -
 29
29 -
 30
30 -
 31
31 -
 32
32 -
 33
33 -
 34
34 -
 35
35 -
 36
36 -
 37
37 -
 38
38 -
 39
39 -
 40
40 -
 41
41 -
 42
42 -
 43
43 -
 44
44 -
 45
45 -
 46
46 -
 47
47 -
 48
48 -
 49
49 -
 50
50 -
 51
51 -
 52
52 -
 53
53 -
 54
54 -
 55
55 -
 56
56 -
 57
57 -
 58
58 -
 59
59 -
 60
60 -
 61
61 -
 62
62 -
 63
63 -
 64
64 -
 65
65 -
 66
66 -
 67
67 -
 68
68 -
 69
69 -
 70
70 -
 71
71 -
 72
72 -
 73
73 -
 74
74 -
 75
75 -
 76
76 -
 77
77 -
 78
78 -
 79
79 -
 80
80 -
 81
81 -
 82
82 -
 83
83 -
 84
84 -
 85
85 -
 86
86 -
 87
87 -
 88
88 -
 89
89 -
 90
90 -
 91
91 -
 92
92 -
 93
93 -
 94
94 -
 95
95 -
 96
96 -
 97
97 -
 98
98 -
 99
99 -
 100
100 -
 101
101 -
 102
102 -
 103
103 -
 104
104 -
 105
105 -
 106
106 -
 107
107 -
 108
108 -
 109
109 -
 110
110 -
 111
111 -
 112
112 -
 113
113 -
 114
114 -
 115
115 -
 116
116 -
 117
117 -
 118
118 -
 119
119 -
 120
120 -
 121
121 -
 122
122 -
 123
123 -
 124
124 -
 125
125 -
 126
126 -
 127
127 -
 128
128 -
 129
129 -
 130
130 -
 131
131 -
 132
132 -
 133
133 -
 134
134 -
 135
135 -
 136
136 -
 137
137 -
 138
138 -
 139
139 -
 140
140 -
 141
141 -
 142
142 -
 143
143 -
 144
144 -
 145
145 -
 146
146 -
 147
147 -
 148
148 -
 149
149 -
 150
150 -
 151
151 -
 152
152 -
 153
153 -
 154
154 -
 155
155 -
 156
156 -
 157
157 -
 158
158 -
 159
159 -
 160
160 -
 161
161 -
 162
162 -
 163
163 -
 164
164 -
 165
165 -
 166
166 -
 167
167 -
 168
168 -
 169
169 -
 170
170 -
 171
171 -
 172
172 -
 173
173 -
 174
174 -
 175
175 -
 176
176 -
 177
177 -
 178
178 -
 179
179 -
 180
180 -
 181
181 -
 182
182 -
 183
183 -
 184
184 -
 185
185 -
 186
186 -
 187
187 -
 188
188 -
 189
189 -
 190
190 -
 191
191 -
 192
192 -
 193
193 -
 194
194 -
 195
195 -
 196
196 -
 197
197
 |
 |

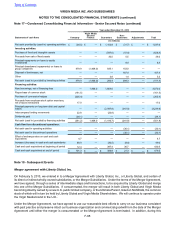
F-55
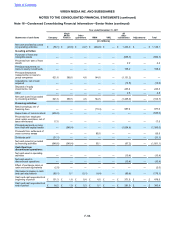
Year ended December 31, 2012
Statements of cash flows Company
Virgin
Media
Finance Other
guarantors VMIH VMIL
All
other
subsidiaries Adjustments Total
(in millions)
Net cash provided by (used
in) operating activities £ (91.5) £ (140.6) £ (3.0) £ (188.3) £ — £ 1,463.1 £ — £ 1,039.7
Investing activities:
Purchase of fixed and
intangible assets — — — — — (783.2) — (783.2)
Proceeds from sale of fixed
assets — — — — — 2.6 — 2.6
Principal drawdowns
(repayments) on loans to
group companies 436.5 14.8 2.8 214.3 — (668.4) — —
Acquisitions, net of cash
acquired —————(0.6) — (0.6)
Disposal of equity
investments, net — — — — — (2.5) — (2.5)
Net cash (used in) provided
by investing activities 436.5 14.8 2.8 214.3 — (1,452.1) — (783.7)
Financing activities:
New borrowings, net of
financing fees — 1,266.8 — 175.0 —(0.1) — 1,441.7
Repurchase of common stock (330.2) — — — — — — (330.2)
Proceeds from employee
stock option exercises, net of
taxes reimbursed 8.2 — — — — — — 8.2
Principal payments on long
term debt and capital leases — (1,141.9) — (175.0) — (98.0) — (1,414.9)
Payments for settlement of
cross currency swaps — — — (26.0) — — — (26.0)
Dividends paid (27.3) — — — — — — (27.3)
Net cash (used in) provided
by financing activities (349.3) 124.9 —(26.0) — (98.1) — (348.5)
Effect of exchange rates on
cash and cash equivalents (1.6) — — — — — — (1.6)
Decrease in cash and cash
equivalents (5.9) (0.9)(0.2) — — (87.1) — (94.1)
Cash and cash equivalents at
beginning of period 16.2 1.9 0.3 0.1 — 281.9 —300.4
Cash and cash equivalents at
end of period £ 10.3 £ 1.0 £ 0.1 £ 0.1 £ — £ 194.8 £ — £ 206.3
Table of Contents
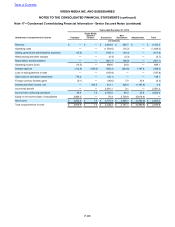
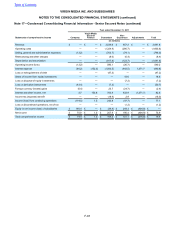
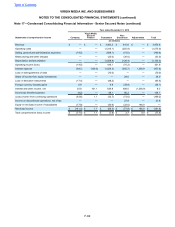
VIRGIN MEDIA INC. AND SUBSIDIARIES
NOTES TO THE CONSOLIDATED FINANCIAL STATEMENTS (continued)
Note 16—Condensed Consolidating Financial Information—Senior Notes (continued)
