Virgin Media 2012 Annual Report Download - page 36
Download and view the complete annual report
Please find page 36 of the 2012 Virgin Media annual report below. You can navigate through the pages in the report by either clicking on the pages listed below, or by using the keyword search tool below to find specific information within the annual report.-
 1
1 -
2
-
3
-
4
-
5
-
6
-
7
-
8
-
9
-
10
-
11
-
12
-
13
-
14
-
15
-
16
-
17
-
18
-
19
-
20
-
21
-
22
-
23
-
24
-
25
-
 26
26 -
 27
27 -
 28
28 -
 29
29 -
 30
30 -
 31
31 -
 32
32 -
 33
33 -
 34
34 -
 35
35 -
 36
36 -
 37
37 -
 38
38 -
 39
39 -
 40
40 -
 41
41 -
 42
42 -
 43
43 -
 44
44 -
 45
45 -
 46
46 -
47
-
48
-
49
-
50
-
51
-
52
-
53
-
54
-
55
-
56
-
57
-
58
-
59
-
60
-
61
-
62
-
63
-
64
-
65
-
66
-
67
-
68
-
69
-
70
-
71
-
72
-
73
-
74
-
75
-
76
-
77
-
78
-
79
-
80
-
81
-
82
-
83
-
84
-
85
-
86
-
87
-
88
-
89
-
90
-
91
-
92
-
93
-
94
-
95
-
96
-
97
-
98
-
99
-
100
-
101
-
102
-
103
-
104
-
105
-
106
-
107
-
108
-
109
-
110
-
111
-
112
-
113
-
114
-
115
-
116
-
117
-
118
-
119
-
120
-
121
-
122
-
123
-
124
-
125
-
126
-
127
-
128
-
129
-
130
-
131
-
132
-
133
-
134
-
135
-
136
-
137
-
138
-
139
-
140
-
141
-
142
-
143
-
144
-
145
-
146
-
147
-
148
-
149
-
150
-
151
-
152
-
153
-
154
-
155
-
156
-
157
-
158
-
159
-
160
-
161
-
162
-
163
-
164
-
165
-
166
-
167
-
168
-
169
-
170
-
171
-
172
-
173
-
174
-
175
-
176
-
177
-
178
-
179
-
180
-
181
-
182
-
183
-
184
-
185
-
186
-
187
-
188
-
189
-
190
-
191
-
192
-
193
-
194
-
195
-
196
-
197
 |
 |

35
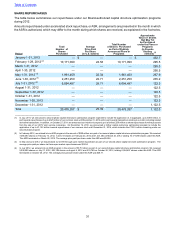
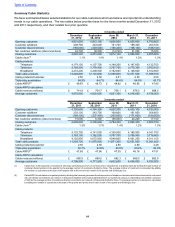
Average monthly cable customer churn for the quarter ended December 31, 2012 fell to 1.1% compared with 1.3% in
the quarter ended December 31, 2011.
Increased subscription to TiVo and strong demand for higher broadband speeds improved the product mix which,
together with a price rise in April 2012, increased monthly average revenue per user for our cable customers, or cable
ARPU. Average monthly cable ARPU for quarter ended December 31, 2012 was £48.87 compared with £47.85 and
£47.51 for the quarters ended December 31, 2011 and 2010 respectively.
Total mobile customer numbers remained flat at 3,037,500 at December 31, 2012 compared to 3,037,300 at December
31, 2011, which decreased from 3,068,900 at December 31, 2010. The movement in both years is consistent with
our strategy to improve our mobile customer mix with, during 2012, an increase in customers taking a mobile phone
on a contract being offset by a broadly comparable decrease in prepaid customer numbers. At December 31, 2012
contract customers represented 56.3% of our mobile based compared with 50.2% and 39.5% at December 31, 2011
and 2010 respectively.
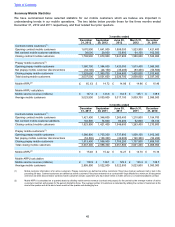
The step down in regulated mobile termination rates reduced inbound mobile revenue by approximately £24 million
during 2012. The impact of this reduction to revenues was offset by the positive impact of an improving customer mix
leading to monthly average revenue per user for our mobile customers, or mobile ARPU, decreasing to £15.13 during
the quarter to December 31, 2012 compared to £15.46 and £15.16 for the quarters to December 31, 2011 and 2010
respectively.
Quad-play penetration, where a household takes all three of our cable products and at least one mobile phone service
from us, increased to approximately 15.8% of our residential cable customer base at December 31, 2012, compared
to approximately 14.5% and 12.2% at December 31, 2011 and 2010 respectively.
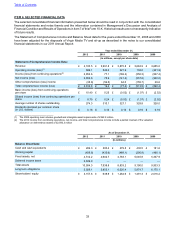
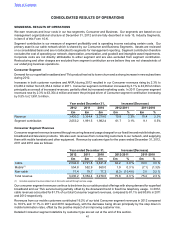
Consumer segment contribution increased to £2,053.2 million for the year compared to £1,991.5 million and £1,982.4
million for 2011 and 2010 respectively. The increase in 2012 arose principally from the higher revenues discussed
above, partially offset by an increase in consumer segment marketing costs in the first half of 2012.
Business Segment
Demand for data across both retail and wholesale markets continues to drive the increase in revenues from our
Business segment, although this increase is partially offset by the continued decline in voice revenues in both markets.
As a result, total revenues from our business segment increased by 5.2% during 2012 to £670.3 million compared to
£637.4 million in 2011 and £596.8 million in 2010.
Increased revenue has been the principal driver of the increase in Business segment contribution to £380.8 million in
2012 compared to £377.4 million and £342.8 million in 2011 and 2010 respectively, although this has been offset by
higher acquisition and delivery costs during the early life of certain significant contracts.
Our Network
We continue to invest in our network infrastructure to support our Consumer and Business products, such as the rollout
of our TiVo service and our broadband speed upgrade, with purchases of fixed assets during 2012 increasing to £783.2
million, of which £101.5 million related to expenditure on our broadband speed upgrade. Fixed assets acquired under
capital leases totaled £88.9 million during 2012, compared to £91.2 million in 2011.
Depreciation of fixed assets increased to £951.7 million in 2012 compared to £923.2 million in 2011, reflecting the
increased fixed asset purchases discussed above.
Network and other operating costs remained flat at 9.5% of total revenues during 2012 and 2011, compared with 10.1%
of total revenues in 2010.
Income Tax Credit
Over the last two decades we have invested over £13 billion building our cable network and have incurred losses in
operating that infrastructure. Under UK tax law certain of these investment costs and operating losses are offset against
future operating profits, giving rise to deferred tax assets. We have historically recorded a full valuation allowance to
reduce the value of these assets to zero.
Under US GAAP accounting principles, we are required to continually evaluate the need for a valuation allowance and
have determined it is more likely than not that in future we will generate sufficient pre-tax income to utilize substantially
all of our UK deferred tax assets related to unclaimed capital allowances and net operating losses. An important factor
in our assessment was the fact that during 2012, we moved into a three year cumulative pre-tax profit position in the
Table of Contents