Virgin Media 2012 Annual Report Download - page 33
Download and view the complete annual report
Please find page 33 of the 2012 Virgin Media annual report below. You can navigate through the pages in the report by either clicking on the pages listed below, or by using the keyword search tool below to find specific information within the annual report.-
 1
1 -
2
-
3
-
4
-
5
-
6
-
7
-
8
-
9
-
10
-
11
-
12
-
13
-
14
-
15
-
16
-
17
-
18
-
19
-
20
-
21
-
22
-
 23
23 -
 24
24 -
 25
25 -
 26
26 -
 27
27 -
 28
28 -
 29
29 -
 30
30 -
 31
31 -
 32
32 -
 33
33 -
 34
34 -
 35
35 -
 36
36 -
 37
37 -
 38
38 -
 39
39 -
 40
40 -
 41
41 -
 42
42 -
 43
43 -
44
-
45
-
46
-
47
-
48
-
49
-
50
-
51
-
52
-
53
-
54
-
55
-
56
-
57
-
58
-
59
-
60
-
61
-
62
-
63
-
64
-
65
-
66
-
67
-
68
-
69
-
70
-
71
-
72
-
73
-
74
-
75
-
76
-
77
-
78
-
79
-
80
-
81
-
82
-
83
-
84
-
85
-
86
-
87
-
88
-
89
-
90
-
91
-
92
-
93
-
94
-
95
-
96
-
97
-
98
-
99
-
100
-
101
-
102
-
103
-
104
-
105
-
106
-
107
-
108
-
109
-
110
-
111
-
112
-
113
-
114
-
115
-
116
-
117
-
118
-
119
-
120
-
121
-
122
-
123
-
124
-
125
-
126
-
127
-
128
-
129
-
130
-
131
-
132
-
133
-
134
-
135
-
136
-
137
-
138
-
139
-
140
-
141
-
142
-
143
-
144
-
145
-
146
-
147
-
148
-
149
-
150
-
151
-
152
-
153
-
154
-
155
-
156
-
157
-
158
-
159
-
160
-
161
-
162
-
163
-
164
-
165
-
166
-
167
-
168
-
169
-
170
-
171
-
172
-
173
-
174
-
175
-
176
-
177
-
178
-
179
-
180
-
181
-
182
-
183
-
184
-
185
-
186
-
187
-
188
-
189
-
190
-
191
-
192
-
193
-
194
-
195
-
196
-
197
 |
 |
32
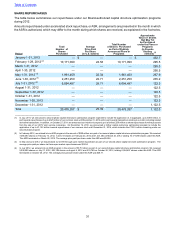
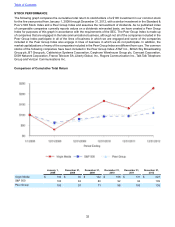
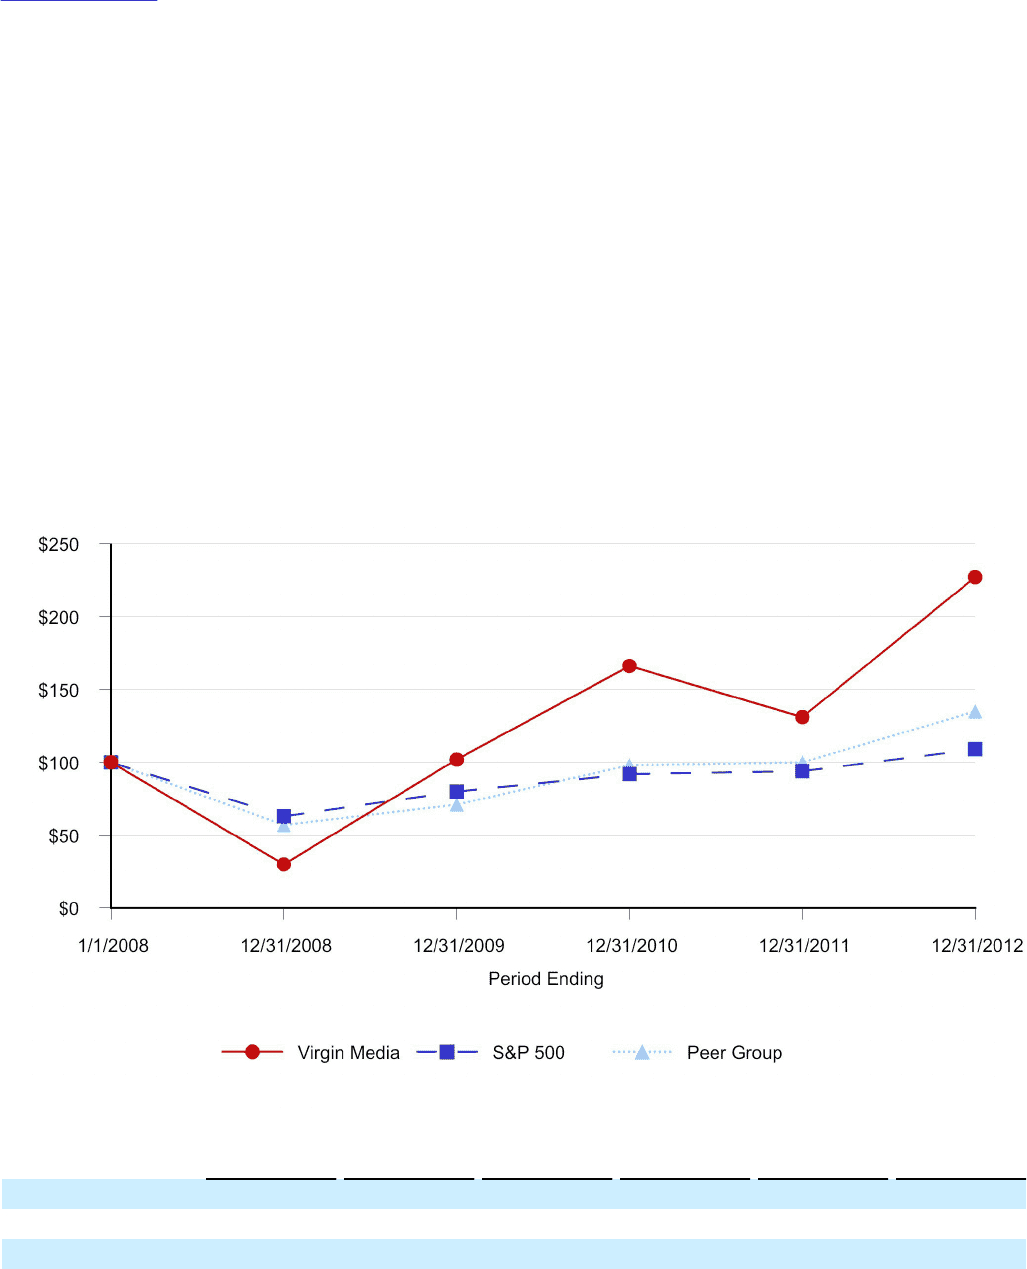
STOCK PERFORMANCE
The following graph compares the cumulative total return to stockholders of a $100 investment in our common stock
for the five-year period from January 1, 2008 through December 31, 2012, with a similar investment in the Standard &
Poor’s 500 Stock Index and a Peer Group Index and assumes the reinvestment of dividends. As no published index
of comparable companies currently reports values on a dividends reinvested basis, we have created a Peer Group
Index for purposes of this graph in accordance with the requirements of the SEC. The Peer Group Index is made up
of companies that are engaged in the telecommunications business, although not all of the companies included in the
Peer Group Index participate in all of the lines of business in which we are engaged and some of the companies
included in the Peer Group Index also engage in lines of business in which we do not participate. In addition, the
market capitalizations of many of the companies included in the Peer Group Index are different from ours. The common
stocks of the following companies have been included in the Peer Group Index: AT&T Inc., British Sky Broadcasting
Group plc, BT Group plc, Cablevision Systems Corporation, Carphone Warehouse Group plc, Comcast Corporation,
DISH Network Corporation, France Telecom SA, Liberty Global, Inc., Rogers Communication Inc., Talk Talk Telephone
Group and Verizon Communications Inc.
Comparison of Cumulative Total Return
January 1,
2008 December 31,
2008 December 31,
2009 December 31,
2010 December 31,
2011 December 31,
2012
Virgin Media $ 100 $ 30 $ 102 $ 166 $ 131 $ 227
S&P 500 100 63 80 92 94 109
Peer Group 100 57 71 98 100 135
Table of Contents