Travelers 2005 Annual Report Download - page 97
Download and view the complete annual report
Please find page 97 of the 2005 Travelers annual report below. You can navigate through the pages in the report by either clicking on the pages listed below, or by using the keyword search tool below to find specific information within the annual report.-
 1
1 -
2
-
3
-
4
-
5
-
6
-
7
-
8
-
9
-
10
-
11
-
12
-
13
-
14
-
15
-
16
-
17
-
18
-
19
-
20
-
21
-
22
-
23
-
24
-
25
-
26
-
27
-
28
-
29
-
30
-
31
-
32
-
33
-
34
-
35
-
36
-
37
-
38
-
39
-
40
-
41
-
42
-
43
-
44
-
45
-
46
-
47
-
48
-
49
-
50
-
51
-
52
-
53
-
54
-
55
-
56
-
57
-
58
-
59
-
60
-
61
-
62
-
63
-
64
-
65
-
66
-
67
-
68
-
69
-
70
-
71
-
72
-
73
-
74
-
75
-
76
-
77
-
78
-
79
-
80
-
81
-
82
-
83
-
84
-
85
-
86
-
 87
87 -
 88
88 -
 89
89 -
 90
90 -
 91
91 -
 92
92 -
 93
93 -
 94
94 -
 95
95 -
 96
96 -
 97
97 -
 98
98 -
 99
99 -
 100
100 -
 101
101 -
 102
102 -
 103
103 -
 104
104 -
 105
105 -
 106
106 -
 107
107 -
108
-
109
-
110
-
111
-
112
-
113
-
114
-
115
-
116
-
117
-
118
-
119
-
120
-
121
-
122
-
123
-
124
-
125
-
126
-
127
-
128
-
129
-
130
-
131
-
132
-
133
-
134
-
135
-
136
-
137
-
138
-
139
-
140
-
141
-
142
-
143
-
144
-
145
-
146
-
147
-
148
-
149
-
150
-
151
-
152
-
153
-
154
-
155
-
156
-
157
-
158
-
159
-
160
-
161
-
162
-
163
-
164
-
165
-
166
-
167
-
168
-
169
-
170
-
171
-
172
-
173
-
174
-
175
-
176
-
177
-
178
-
179
-
180
-
181
-
182
-
183
-
184
-
185
-
186
-
187
-
188
-
189
-
190
-
191
-
192
-
193
-
194
-
195
-
196
-
197
-
198
-
199
-
200
-
201
-
202
-
203
-
204
-
205
-
206
-
207
-
208
-
209
-
210
-
211
-
212
-
213
-
214
-
215
-
216
-
217
-
218
-
219
-
220
-
221
-
222
-
223
-
224
-
225
-
226
-
227
-
228
-
229
-
230
-
231
-
232
-
233
-
234
-
235
-
236
-
237
-
238
-
239
-
240
-
241
-
242
-
243
-
244
-
245
-
246
-
247
-
248
-
249
-
250
-
251
-
252
-
253
-
254
-
255
-
256
-
257
-
258
 |
 |

85
increased taxes, licenses and fees by $25 million. These factors combined to result in a 0.5 point negative
impact on the Personal segment’s 2005 underwriting expense ratio. In 2004, the 1.2 increase in the
underwriting expense ratio over 2003 reflected the impact of the same investments described above.
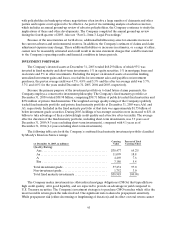
Written Premiums
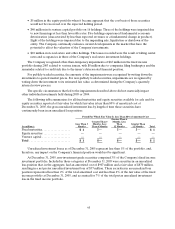
Personal gross and net written premiums by product line were as follows:
2005 2004 2003
(for the year ended December 31, in millions) Gross Net Gross Net Gross Net
Automobile ............................... $ 3 ,526 $ 3,477 $3,470 $3,433 $3,092 $3,054
Homeowners and Other. .................... 2,948 2,751 2,641 2,496 2,153 2,027
Total Personal ........................... $ 6 ,474 $ 6,228 $6,111 $5,929 $5,245 $5,081
Gross and net written premiums in 2005 increased 6% and 5%, respectively, over 2004. Growth in
2005 was concentrated in the Homeowners and Other product line, driven by continued renewal price
increases and unit growth. Retention levels in both the Automobile and Homeowners and Other lines of
business remained strong, and were consistent with 2004. In the Automobile line, renewal price increases
in 2005 remained positive, but declined when compared with 2004. However, new business premiums in
2005 in the Automobile line increased over 2004, primarily due to the introduction of the Company’s new
multivariate pricing product in selected states. Net written premiums in 2005 were reduced by $21 million
of catastrophe-related reinstatement premiums described in the “Consolidated Overview” section herein.
Gross and net written premiums in 2004 increased 17% over 2003. Both Automobile and
Homeowners and other net written premiums increased in 2004 due to higher new business volumes, the
impact of new business associated with the Royal & SunAlliance renewal rights transaction entered into in
the third quarter of 2003, continued strong retention, and renewal price increases.
The Personal segment had approximately 6.6 million and 6.3 million policies in force at December 31,
2005 and 2004, respectively. In the Automobile lineofbusiness, policies in force at December 31, 2005
increased 4% over the same date in 2004. Policies in force in the Homeowners and Other line of business
at December 31, 2005 grew by 5% over the same date in 2004. Effective in the first quarter of 2005,
Homeowners and Other policies inforce include certain endorsements that had previously not been
counted as separate policies. Prior year periods were restated to conform to the current year presentation.
In the Automobile lineof business, policies in force at December 31, 2004 increased 9% over 2003.
Policies in force in the Homeowners and Other lineof business at December 31, 2004 increased by 15%
over 2003.
Interest Expense and Other
(for the year ended December 31, in millions) 2005 2004 2003
Net loss.............................................. $ ( 184) $ (182 ) $ (112 )
The increase in net loss for Interest Expense and Other for 2005 compared with 2004 was primarily
due to incremental interest expense on debt assumed in the merger and a reduction in net investment
income, which were mostly offset by the absence of non-recurringmerger-related charges and a reduction
in non-interest related other expenses in 2005.
The net loss for Interest Expense and Other for the year ended December 31, 2004 increased
$70million compared with 2003, primarily reflectingthe impact of the merger. Included in the increase
was $46 million of incremental interest expense on debt assumed in the merger. The 2004 total also
included $9 million of charges related to the merger that were recorded in the second quarter.