Travelers 2005 Annual Report Download - page 244
Download and view the complete annual report
Please find page 244 of the 2005 Travelers annual report below. You can navigate through the pages in the report by either clicking on the pages listed below, or by using the keyword search tool below to find specific information within the annual report.-
 1
1 -
2
-
3
-
4
-
5
-
6
-
7
-
8
-
9
-
10
-
11
-
12
-
13
-
14
-
15
-
16
-
17
-
18
-
19
-
20
-
21
-
22
-
23
-
24
-
25
-
26
-
27
-
28
-
29
-
30
-
31
-
32
-
33
-
34
-
35
-
36
-
37
-
38
-
39
-
40
-
41
-
42
-
43
-
44
-
45
-
46
-
47
-
48
-
49
-
50
-
51
-
52
-
53
-
54
-
55
-
56
-
57
-
58
-
59
-
60
-
61
-
62
-
63
-
64
-
65
-
66
-
67
-
68
-
69
-
70
-
71
-
72
-
73
-
74
-
75
-
76
-
77
-
78
-
79
-
80
-
81
-
82
-
83
-
84
-
85
-
86
-
87
-
88
-
89
-
90
-
91
-
92
-
93
-
94
-
95
-
96
-
97
-
98
-
99
-
100
-
101
-
102
-
103
-
104
-
105
-
106
-
107
-
108
-
109
-
110
-
111
-
112
-
113
-
114
-
115
-
116
-
117
-
118
-
119
-
120
-
121
-
122
-
123
-
124
-
125
-
126
-
127
-
128
-
129
-
130
-
131
-
132
-
133
-
134
-
135
-
136
-
137
-
138
-
139
-
140
-
141
-
142
-
143
-
144
-
145
-
146
-
147
-
148
-
149
-
150
-
151
-
152
-
153
-
154
-
155
-
156
-
157
-
158
-
159
-
160
-
161
-
162
-
163
-
164
-
165
-
166
-
167
-
168
-
169
-
170
-
171
-
172
-
173
-
174
-
175
-
176
-
177
-
178
-
179
-
180
-
181
-
182
-
183
-
184
-
185
-
186
-
187
-
188
-
189
-
190
-
191
-
192
-
193
-
194
-
195
-
196
-
197
-
198
-
199
-
200
-
201
-
202
-
203
-
204
-
205
-
206
-
207
-
208
-
209
-
210
-
211
-
212
-
213
-
214
-
215
-
216
-
217
-
218
-
219
-
220
-
221
-
222
-
223
-
224
-
225
-
226
-
227
-
228
-
229
-
230
-
231
-
232
-
233
-
 234
234 -
 235
235 -
 236
236 -
 237
237 -
 238
238 -
 239
239 -
 240
240 -
 241
241 -
 242
242 -
 243
243 -
 244
244 -
 245
245 -
 246
246 -
 247
247 -
 248
248 -
 249
249 -
 250
250 -
 251
251 -
 252
252 -
 253
253 -
 254
254 -
255
-
256
-
257
-
258
 |
 |

232
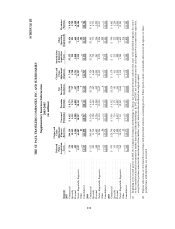
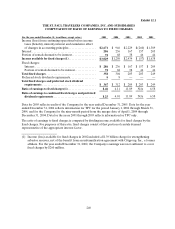
SCHEDULE III
THE ST. PAUL TRAVELERS COMPANIES, INC.AND SUBSIDIARIES
Supplementary Insurance Information
2003-2005
(in millions)
Segment
Deferred
Policy
Acquisition
Costs
Claims and
Claim
Adjustment
Expense
Reserves
Unearned
Premiums
Premium
Revenue
Net
Investment
Income(a)
Claims and
Claim
Adjustment
Expenses
Amortization
of Deferred
Acquisition
Costs
Other
Operating
Expenses(b)
Premiums
Written
2005
Commercial..................... $ 556 $ 4 4,154 $4,612 $8,574 $1,944 $7,448 $1,252 $1,656 $8,429
Specialty........................ 482 12,549 3,335 5,739 757 3,728 952 893 5,729
Personal........................ 489 4,304 2,980 6,028 457 3,751 1,048 665 6,228
Total—Reportable Segments........ 1,527 61,007 10,927 20,341 3,158 14,927 3,252 3,214 20,386
Other .......................... — 83 — —7 — — 301 —
Consolidated..................... $1,527 $ 61,090 $ 1 0,927 $ 2 0,341 $3,165 $ 1 4,927 $3,252 $3,515 $ 2 0,386
2004
Commercial..................... $621 $ 43,669 $5,026 $8,816 $ 1,728$7,524$ 1 ,245 $ 1,581$8,311
Specialty........................ 490 11,712 3,528 4,642487 4,660792 7794,771
Personal........................ 448 3,6032,756 5,580442 3,255 941536 5,929
Total—ReportableSegments........ 1,559 58,984 11,310 19,038 2,657 15,439 2,9782,896 19,011
Other .......................... —86 —— 6——285 —
Consolidated..................... $ 1,559$ 5 9,070 $ 11,310 $ 19,038 $ 2,663$ 1 5,439 $ 2,978$ 3 ,181 $ 19,011
2003
Commercial..................... $470 $28,746 $ 3,958$ 6,552 $1,324 $ 5,170$971$990$ 6,862
Specialty........................ 119 2,428714 1,171183 613213 2221,258
Personal........................ 376 3,3002,439 4,822361 3,335 800420 5,081
Total—Reportable Segments........ 96534,474 7,11112,545 1,8689,118 1,9841,632 13,201
Other .......................... —99 —— 1——176 —
Consolidated..................... $965 $ 34,573 $7,111 $ 12,545 $ 1,869$9,118$ 1 ,984 $ 1,808$ 1 3,201
(a) Beginning in the second quarter of 2004, the Company developed a methodology to allocate net investment income and invested assets to the identified segments. See note 1
to the consolidated financial statements for further discussion of this methodology. In2002 and 2003, net investment income for each segment was accounted for separately,
except for the portion earned on the investment of shareholders’ equity, which was allocated based on assigned capital.
(b) Expense allocations are determined in accordance with prescribed statutory accounting practices. These practices make a reasonable allocation of all expenses to those
product lines with which they are associated.