Travelers 2005 Annual Report Download - page 89
Download and view the complete annual report
Please find page 89 of the 2005 Travelers annual report below. You can navigate through the pages in the report by either clicking on the pages listed below, or by using the keyword search tool below to find specific information within the annual report.-
 1
1 -
2
-
3
-
4
-
5
-
6
-
7
-
8
-
9
-
10
-
11
-
12
-
13
-
14
-
15
-
16
-
17
-
18
-
19
-
20
-
21
-
22
-
23
-
24
-
25
-
26
-
27
-
28
-
29
-
30
-
31
-
32
-
33
-
34
-
35
-
36
-
37
-
38
-
39
-
40
-
41
-
42
-
43
-
44
-
45
-
46
-
47
-
48
-
49
-
50
-
51
-
52
-
53
-
54
-
55
-
56
-
57
-
58
-
59
-
60
-
61
-
62
-
63
-
64
-
65
-
66
-
67
-
68
-
69
-
70
-
71
-
72
-
73
-
74
-
75
-
76
-
77
-
78
-
 79
79 -
 80
80 -
 81
81 -
 82
82 -
 83
83 -
 84
84 -
 85
85 -
 86
86 -
 87
87 -
 88
88 -
 89
89 -
 90
90 -
 91
91 -
 92
92 -
 93
93 -
 94
94 -
 95
95 -
 96
96 -
 97
97 -
 98
98 -
 99
99 -
100
-
101
-
102
-
103
-
104
-
105
-
106
-
107
-
108
-
109
-
110
-
111
-
112
-
113
-
114
-
115
-
116
-
117
-
118
-
119
-
120
-
121
-
122
-
123
-
124
-
125
-
126
-
127
-
128
-
129
-
130
-
131
-
132
-
133
-
134
-
135
-
136
-
137
-
138
-
139
-
140
-
141
-
142
-
143
-
144
-
145
-
146
-
147
-
148
-
149
-
150
-
151
-
152
-
153
-
154
-
155
-
156
-
157
-
158
-
159
-
160
-
161
-
162
-
163
-
164
-
165
-
166
-
167
-
168
-
169
-
170
-
171
-
172
-
173
-
174
-
175
-
176
-
177
-
178
-
179
-
180
-
181
-
182
-
183
-
184
-
185
-
186
-
187
-
188
-
189
-
190
-
191
-
192
-
193
-
194
-
195
-
196
-
197
-
198
-
199
-
200
-
201
-
202
-
203
-
204
-
205
-
206
-
207
-
208
-
209
-
210
-
211
-
212
-
213
-
214
-
215
-
216
-
217
-
218
-
219
-
220
-
221
-
222
-
223
-
224
-
225
-
226
-
227
-
228
-
229
-
230
-
231
-
232
-
233
-
234
-
235
-
236
-
237
-
238
-
239
-
240
-
241
-
242
-
243
-
244
-
245
-
246
-
247
-
248
-
249
-
250
-
251
-
252
-
253
-
254
-
255
-
256
-
257
-
258
 |
 |

77
Accounts declined slightly from 2004. Select Accounts’ 2004 premium volume of $2.56 billion increased $508
million, or 25%, over 2003, reflecting the impact of the merger. Overall retention levels were strong and
renewal price increases moderated to the mid single-digits in 2004. Retention and growth in 2004 reflected
the Company’s competitive advantage in agency automation, product offerings and service to agents in this
hightransaction volume business.
In National Accounts, gross written premiums in 2005 grew 9% over 2004, and net written premiums
grew $190 million, or 18%, compared with 2004, which reflected the impact of the merger and changes in
Discover Re’s reinsurance program. The 25% increase in National Accounts’ net premium volume in 2004
over 2003 reflected new business from the third-quarter 2003 Royal & SunAlliance renewal rights transaction
and higher business volumes in residual market pools, the impacts of which were partially offset by a shift to
deductible and fee-based products by some of the Company’s clients.During 2005, results of the Company’s
Discover Re operation were reclassified from the Specialty segment to National Accounts in the Commercial
segment. All prior period amounts were reclassified to be consistentwith the 2005 presentation.
In Commercial Other, the 82% and 31% declines in 2005 and 2004net premium volume, respectively,
compared with the respective prior years reflected the intentional non-renewal of business in the runoff
operations comprising this category (primarily Gulf). Certain business previously written by Gulf is now being
written elsewhere in the Commercial or Specialty segments. The runoff healthcare, reinsurance and
international business acquired in the merger produced minimal written premium volume in 2005 and 2004.
In 2003, Commercial Other consisted primarily of results from the Gulf operation, which marketed products
to national, mid-sized and small customers and distributed them through both wholesale brokers and retail
agents and brokers throughout the United States with particular emphasis on management and professional
liability coverages and excess and surplus linesofinsurance.
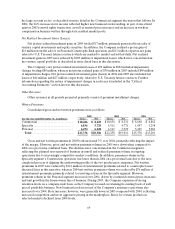
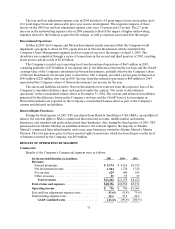
Specialty
Results of the Company’s Specialty segment were as follows:
(for the year ended December 31, in millions) 2005 2004 2003
Revenues:
Earned premiums ................................ $5,739 $4,642 $1,171
Net investment income ........................... 757 487 183
Fee income...................................... 35 26 15
Other revenues .................................. 29 22 8
Total revenues................................... $6,560 $5,177 $1,377
Total claims and expenses........................... $5,573 $6,231 $1,048
Operating income (loss) ............................ $ 679 $(648 ) $234
Loss and lossadjustment expense ratio. ............... 64.6% 100.1 % 51.3 %
Underwriting expense ratio. ......................... 31.8 33.5 36.0
GAAP combined ratio ............................ 96.4% 133.6 % 87.3 %
The Specialty segment’s results for the twelve months ended December 31, 2004 reflect the results of
TPC’s Bond and Construction operationsfor the twelvemonths ended December 31, 2004 and the post-
merger results of SPC’s specialty operations, including SPC’s Bond and Construction operations for thenine
months ended December 31, 2004. Results for 2003 represent TPC’s Bond and Construction operationsonly.