Travelers 2005 Annual Report Download - page 229
Download and view the complete annual report
Please find page 229 of the 2005 Travelers annual report below. You can navigate through the pages in the report by either clicking on the pages listed below, or by using the keyword search tool below to find specific information within the annual report.-
 1
1 -
2
-
3
-
4
-
5
-
6
-
7
-
8
-
9
-
10
-
11
-
12
-
13
-
14
-
15
-
16
-
17
-
18
-
19
-
20
-
21
-
22
-
23
-
24
-
25
-
26
-
27
-
28
-
29
-
30
-
31
-
32
-
33
-
34
-
35
-
36
-
37
-
38
-
39
-
40
-
41
-
42
-
43
-
44
-
45
-
46
-
47
-
48
-
49
-
50
-
51
-
52
-
53
-
54
-
55
-
56
-
57
-
58
-
59
-
60
-
61
-
62
-
63
-
64
-
65
-
66
-
67
-
68
-
69
-
70
-
71
-
72
-
73
-
74
-
75
-
76
-
77
-
78
-
79
-
80
-
81
-
82
-
83
-
84
-
85
-
86
-
87
-
88
-
89
-
90
-
91
-
92
-
93
-
94
-
95
-
96
-
97
-
98
-
99
-
100
-
101
-
102
-
103
-
104
-
105
-
106
-
107
-
108
-
109
-
110
-
111
-
112
-
113
-
114
-
115
-
116
-
117
-
118
-
119
-
120
-
121
-
122
-
123
-
124
-
125
-
126
-
127
-
128
-
129
-
130
-
131
-
132
-
133
-
134
-
135
-
136
-
137
-
138
-
139
-
140
-
141
-
142
-
143
-
144
-
145
-
146
-
147
-
148
-
149
-
150
-
151
-
152
-
153
-
154
-
155
-
156
-
157
-
158
-
159
-
160
-
161
-
162
-
163
-
164
-
165
-
166
-
167
-
168
-
169
-
170
-
171
-
172
-
173
-
174
-
175
-
176
-
177
-
178
-
179
-
180
-
181
-
182
-
183
-
184
-
185
-
186
-
187
-
188
-
189
-
190
-
191
-
192
-
193
-
194
-
195
-
196
-
197
-
198
-
199
-
200
-
201
-
202
-
203
-
204
-
205
-
206
-
207
-
208
-
209
-
210
-
211
-
212
-
213
-
214
-
215
-
216
-
217
-
218
-
 219
219 -
 220
220 -
 221
221 -
 222
222 -
 223
223 -
 224
224 -
 225
225 -
 226
226 -
 227
227 -
 228
228 -
 229
229 -
 230
230 -
 231
231 -
 232
232 -
 233
233 -
 234
234 -
 235
235 -
 236
236 -
 237
237 -
 238
238 -
 239
239 -
240
-
241
-
242
-
243
-
244
-
245
-
246
-
247
-
248
-
249
-
250
-
251
-
252
-
253
-
254
-
255
-
256
-
257
-
258
 |
 |

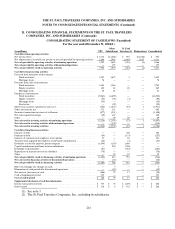
THE ST. PAUL TRAVELERS COMPANIES, INC.AND SUBSIDIARIES
NOTES TO CONSOLIDATED FINANCIAL STATEMENTS (Continued)
217
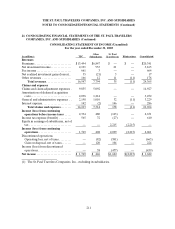
22.SELECTED QUARTERLY FINANCIAL DATA (Unaudited)
2005 (in millions, except per share data)
First
Quarter
Second
Quarter
Third
Quarter
Fourth
Quarter Total
Total revenues.............................. $ 6,105$ 6 ,037 $ 6,042 $ 6,181 $ 24,365
Total expenses .............................. 4,9174,743 6,050 5,984 21,694
Income (loss) from continuing operations before
income taxes.............................. 1,1881,294 (8 ) 197 2,671
Income tax expense (benefit)................. 311363 (83 ) 19 610
Income from continuingoperations. ........... 877931 75 178 2,061
Income (loss) from discontinued operations .... (665) 13887 1 (439)
Net income ................................. $ 212$ 1 ,069 $ 162 $ 179 $ 1,622
Net income per share:(1)
Basic .................................. $ 0.31 $ 1.59 $ 0.24 $ 0.26 $ 2.39
Diluted ................................ 0.31 1.52 0.23 0.26 2.33
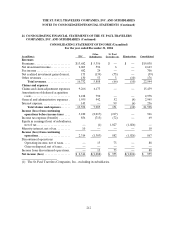
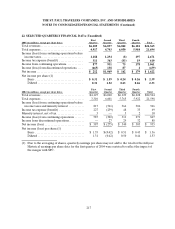
2004 (in millions, except per share data)
First
Quarter
Second
Quarter
Third
Quarter
Fourth
Quarter Total
Total revenues ............................... $ 4,127$ 6 ,060 $ 6,129$6,228 $ 22,544
Total expenses ............................... 3,3106,601 5,7655
,922 21,598
Income (loss) from continuing operations before
income taxes and minority interest........... 817(541) 3643
06 946
Income tax expense (benefit).................. 227(239) 48 33 69
Minority interest, net of tax.................... 3— 52 10
Income (loss) from continuing operations....... 587(302) 311271 867
Income from discontinued operations. .......... —272932 88
Net income (loss) ............................ $587 $(275) $340 $303 $ 955
Net income (loss) per share:(1)
Basic ................................... $1.35 $(0.42) $0.51$0.45 $1.56
Diluted ................................. 1.31(0.42) 0.50 0.44 1.53
(1) Due to the averaging of shares, quarterly earnings per share may not add to the total for the full year.
Historical earnings per share data for the first quarter of 2004 were restated to reflect the impact of
the merger with SPC.