Travelers 2005 Annual Report Download - page 22
Download and view the complete annual report
Please find page 22 of the 2005 Travelers annual report below. You can navigate through the pages in the report by either clicking on the pages listed below, or by using the keyword search tool below to find specific information within the annual report.-
 1
1 -
2
-
3
-
4
-
5
-
6
-
7
-
8
-
9
-
10
-
11
-
 12
12 -
 13
13 -
 14
14 -
 15
15 -
 16
16 -
 17
17 -
 18
18 -
 19
19 -
 20
20 -
 21
21 -
 22
22 -
 23
23 -
 24
24 -
 25
25 -
 26
26 -
 27
27 -
 28
28 -
 29
29 -
 30
30 -
 31
31 -
 32
32 -
33
-
34
-
35
-
36
-
37
-
38
-
39
-
40
-
41
-
42
-
43
-
44
-
45
-
46
-
47
-
48
-
49
-
50
-
51
-
52
-
53
-
54
-
55
-
56
-
57
-
58
-
59
-
60
-
61
-
62
-
63
-
64
-
65
-
66
-
67
-
68
-
69
-
70
-
71
-
72
-
73
-
74
-
75
-
76
-
77
-
78
-
79
-
80
-
81
-
82
-
83
-
84
-
85
-
86
-
87
-
88
-
89
-
90
-
91
-
92
-
93
-
94
-
95
-
96
-
97
-
98
-
99
-
100
-
101
-
102
-
103
-
104
-
105
-
106
-
107
-
108
-
109
-
110
-
111
-
112
-
113
-
114
-
115
-
116
-
117
-
118
-
119
-
120
-
121
-
122
-
123
-
124
-
125
-
126
-
127
-
128
-
129
-
130
-
131
-
132
-
133
-
134
-
135
-
136
-
137
-
138
-
139
-
140
-
141
-
142
-
143
-
144
-
145
-
146
-
147
-
148
-
149
-
150
-
151
-
152
-
153
-
154
-
155
-
156
-
157
-
158
-
159
-
160
-
161
-
162
-
163
-
164
-
165
-
166
-
167
-
168
-
169
-
170
-
171
-
172
-
173
-
174
-
175
-
176
-
177
-
178
-
179
-
180
-
181
-
182
-
183
-
184
-
185
-
186
-
187
-
188
-
189
-
190
-
191
-
192
-
193
-
194
-
195
-
196
-
197
-
198
-
199
-
200
-
201
-
202
-
203
-
204
-
205
-
206
-
207
-
208
-
209
-
210
-
211
-
212
-
213
-
214
-
215
-
216
-
217
-
218
-
219
-
220
-
221
-
222
-
223
-
224
-
225
-
226
-
227
-
228
-
229
-
230
-
231
-
232
-
233
-
234
-
235
-
236
-
237
-
238
-
239
-
240
-
241
-
242
-
243
-
244
-
245
-
246
-
247
-
248
-
249
-
250
-
251
-
252
-
253
-
254
-
255
-
256
-
257
-
258
 |
 |

10
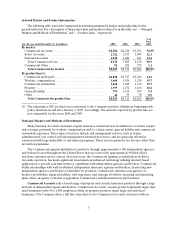
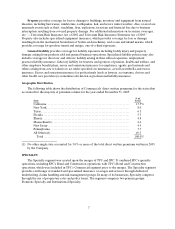
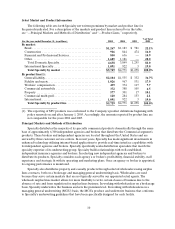
Select Market and Product Information
The following table sets forth Specialty net written premiums by market and product line for
the periods indicated. For a description of the markets and product lines referred to in the table,
see “—Principal Markets and Methods of Distribution” and “—Product Lines,” respectively.
(for the year ended December 31, in millions) 2005 2004 2003
% of Total
2005
By market:
Bond................................................. $1,267 $1,183 $781 22.1%
Construction .......................................... 916 844 474 16.0
Financial andProfessional Services....................... 850 636 — 14.9
Other. ................................................ 1,605 1,186 — 28.0
Total Domestic Specialty.............................. 4,638 3,849 1,255 81.0
International Specialty .................................. 1,091 922 3 19.0
Total Specialty by market............................. $5,729 $4,771 $1,258 100.0%
By product line(1):
General liability. ....................................... $2,104 $1,535 $332 36.7%
Fidelity and surety...................................... 1,026 967 531 17.9
Workers’ compensation................................. 439 374 117 7.7
Commercial automobile ................................ 372 388 105 6.5
Property .............................................. 577 301 17 10.1
Commercial multi-peril ................................. 120 284 153 2.1
International .......................................... 1,091 922 3 19.0
Total Specialty by product line......................... $5,729 $4,771 $1,258 100.0%
(1) The reporting of SPC products was conformed to the Company’s product definitions beginning with
policy renewals on and after January 1, 2005. Accordingly, the amounts reported by product line are
not comparable for the years 2004 and 2005.
Principal Markets and Methodsof Distribution
Specialty distributes the majority of its specialty commercial products domestically through the same
base of approximately 6,300 independent agencies and brokers that distribute the Commercial segment’s
products. These brokers and independent agencies are located throughout the United States and are
serviced by three customer service centers. In recent years, Specialty has made significant investments in
enhanced technology utilizing internet-based applications to provide real-time interface capabilities with
its independent agencies and brokers. Specialty specifically seeks distribution specialists that match the
specialty expertise of its underwriting group. Specialty builds relationships with well-established,
independent insurance agencies and brokers. In selecting new independent agencies and brokers to
distribute its products, Specialty considers each agency’s or broker’s profitability, financial stability, staff
experience and strategic fit with its operating and marketing plans. Once an agency or broker is appointed,
its ongoing performance is monitored.
Specialty also distributes property and casualty products through selected wholesalers using surplus
lines contracts, both on a brokerage and managinggeneral underwritingbasis. Wholesalers are used
because they serve certain markets that are not typically served by our appointed retail agents. The
wholesale surplus lines market allows for more flexibility to write certain classes of business due to the
absence of rate and form regulation for surplus lines business. In working with wholesalers on a brokerage
basis, Specialty underwrites the business and sets the premium level. In working with wholesalers on a
managing general underwriting (MGU) basis, the MGUs produce and underwrite business that conforms
to Specialty’s underwritingguidelines that have been specifically designed for each facility.