Travelers 2005 Annual Report Download - page 105
Download and view the complete annual report
Please find page 105 of the 2005 Travelers annual report below. You can navigate through the pages in the report by either clicking on the pages listed below, or by using the keyword search tool below to find specific information within the annual report.-
 1
1 -
2
-
3
-
4
-
5
-
6
-
7
-
8
-
9
-
10
-
11
-
12
-
13
-
14
-
15
-
16
-
17
-
18
-
19
-
20
-
21
-
22
-
23
-
24
-
25
-
26
-
27
-
28
-
29
-
30
-
31
-
32
-
33
-
34
-
35
-
36
-
37
-
38
-
39
-
40
-
41
-
42
-
43
-
44
-
45
-
46
-
47
-
48
-
49
-
50
-
51
-
52
-
53
-
54
-
55
-
56
-
57
-
58
-
59
-
60
-
61
-
62
-
63
-
64
-
65
-
66
-
67
-
68
-
69
-
70
-
71
-
72
-
73
-
74
-
75
-
76
-
77
-
78
-
79
-
80
-
81
-
82
-
83
-
84
-
85
-
86
-
87
-
88
-
89
-
90
-
91
-
92
-
93
-
94
-
 95
95 -
 96
96 -
 97
97 -
 98
98 -
 99
99 -
 100
100 -
 101
101 -
 102
102 -
 103
103 -
 104
104 -
 105
105 -
 106
106 -
 107
107 -
 108
108 -
 109
109 -
 110
110 -
 111
111 -
 112
112 -
 113
113 -
 114
114 -
 115
115 -
116
-
117
-
118
-
119
-
120
-
121
-
122
-
123
-
124
-
125
-
126
-
127
-
128
-
129
-
130
-
131
-
132
-
133
-
134
-
135
-
136
-
137
-
138
-
139
-
140
-
141
-
142
-
143
-
144
-
145
-
146
-
147
-
148
-
149
-
150
-
151
-
152
-
153
-
154
-
155
-
156
-
157
-
158
-
159
-
160
-
161
-
162
-
163
-
164
-
165
-
166
-
167
-
168
-
169
-
170
-
171
-
172
-
173
-
174
-
175
-
176
-
177
-
178
-
179
-
180
-
181
-
182
-
183
-
184
-
185
-
186
-
187
-
188
-
189
-
190
-
191
-
192
-
193
-
194
-
195
-
196
-
197
-
198
-
199
-
200
-
201
-
202
-
203
-
204
-
205
-
206
-
207
-
208
-
209
-
210
-
211
-
212
-
213
-
214
-
215
-
216
-
217
-
218
-
219
-
220
-
221
-
222
-
223
-
224
-
225
-
226
-
227
-
228
-
229
-
230
-
231
-
232
-
233
-
234
-
235
-
236
-
237
-
238
-
239
-
240
-
241
-
242
-
243
-
244
-
245
-
246
-
247
-
248
-
249
-
250
-
251
-
252
-
253
-
254
-
255
-
256
-
257
-
258
 |
 |

93
with policyholders in bankruptcy where negotiationsoften involve a large number of claimants and other
parties and require court approval to be effective. As part of its continuing analysis of asbestos reserves,
which includes an annual ground-up review of asbestos policyholders, the Company continues to study the
implications of these and other developments. The Company completed the annual ground-up review
during the fourth quarter of 2005. Also see “Part I—Item 3, Legal Proceedings.”
Because of the uncertainties set forth above, additional liabilities may arise for amounts in excess of
the current asbestos and environmental reserves. In addition, the Company’s estimate of claims and claim
adjustment expenses may change. These additional liabilities or increases in estimates, or a range of either,
cannot now be reasonably estimated and could result in income statement charges that could be material
to the Company’s operating results and financial condition in future periods.
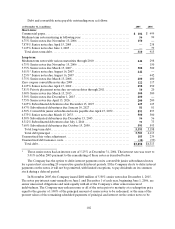
INVESTMENT PORTFOLIO
The Company’s invested assets at December 31, 2005 totaled $68.29 billion, of which 93% was
invested in fixed maturity and short-term investments,1% in equity securities, 1% in mortgage loans and
real estate and 5% in other investments. Excluding the impact on invested assets of securities lending,
unrealized investment gains and losses, receivables for investment sales and payables on investment
purchases, the pretax average yield was 4.7%, 4.8% and 5.3% and the after tax average yield was 3.7%,
3.7% and 4.0% for the years ended December 31, 2005, 2004 and 2003, respectively.
Because the primary purpose of the investment portfolio is to fund future claims payments, the
Company employs a conservative investment philosophy. The Company’s fixed maturity portfolio at
December 31, 2005 totaled $58.98 billion, comprising $58.71 billion of publicly traded fixed maturities and
$274 million of private fixed maturities. The weighted average quality ratings of the Company’s publicly
traded fixed maturity portfolio and private fixed maturity portfolio at December 31, 2005 were AA1 and
A3, respectively. Included in the fixed maturity portfolio at that date was approximately $1.75 billion of
below investment grade securities. During 2005, holdings of tax-exempt securities were increased to $31.46
billion to take advantage of their relatively high credit quality and attractive after-tax yields. The average
effective duration of the fixed maturity portfolio, including short-term investments, was 3.9 years as of
December 31, 2005 (4.3 years excluding short-term investments), compared with 4.1 years as of
December 31, 2004 (4.4 years excluding short-term investments).
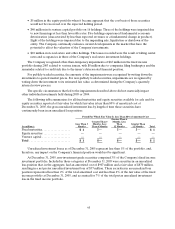
The following table sets forth the Company’s combined fixed maturity investment portfolio classified
by Moody’s Investors Service ratings:
(at December 31, 2005, in millions)
Carrying
Value
Percent of Total
Carrying Value
Quality Rating:
Aaa.............................................. $38,477 65.2%
Aa ............................................... 11,099 18.8
A4,469 7.6
Baa.............................................. 3,186 5.4
Total investment grade ............................... 57,231 97.0
Non-investment grade ................................ 1,7523.0
Total fixed maturity investments....................... $58,983 100.0%
The Company makes investments in collateralized mortgage obligations (CMOs) that typically have
high credit quality, offer good liquidity, and are expected to provide an advantage in yield compared to
U.S. Treasury securities. The Company’s investment strategy is to purchase CMO tranches which offer the
most favorable return given the risks involved. One significant risk evaluated is prepayment sensitivity.
While prepayment risk (either shortening or lengthening of duration) and its effect on total return cannot