Travelers 2005 Annual Report Download - page 133
Download and view the complete annual report
Please find page 133 of the 2005 Travelers annual report below. You can navigate through the pages in the report by either clicking on the pages listed below, or by using the keyword search tool below to find specific information within the annual report.-
 1
1 -
2
-
3
-
4
-
5
-
6
-
7
-
8
-
9
-
10
-
11
-
12
-
13
-
14
-
15
-
16
-
17
-
18
-
19
-
20
-
21
-
22
-
23
-
24
-
25
-
26
-
27
-
28
-
29
-
30
-
31
-
32
-
33
-
34
-
35
-
36
-
37
-
38
-
39
-
40
-
41
-
42
-
43
-
44
-
45
-
46
-
47
-
48
-
49
-
50
-
51
-
52
-
53
-
54
-
55
-
56
-
57
-
58
-
59
-
60
-
61
-
62
-
63
-
64
-
65
-
66
-
67
-
68
-
69
-
70
-
71
-
72
-
73
-
74
-
75
-
76
-
77
-
78
-
79
-
80
-
81
-
82
-
83
-
84
-
85
-
86
-
87
-
88
-
89
-
90
-
91
-
92
-
93
-
94
-
95
-
96
-
97
-
98
-
99
-
100
-
101
-
102
-
103
-
104
-
105
-
106
-
107
-
108
-
109
-
110
-
111
-
112
-
113
-
114
-
115
-
116
-
117
-
118
-
119
-
120
-
121
-
122
-
 123
123 -
 124
124 -
 125
125 -
 126
126 -
 127
127 -
 128
128 -
 129
129 -
 130
130 -
 131
131 -
 132
132 -
 133
133 -
 134
134 -
 135
135 -
 136
136 -
 137
137 -
 138
138 -
 139
139 -
 140
140 -
 141
141 -
 142
142 -
 143
143 -
144
-
145
-
146
-
147
-
148
-
149
-
150
-
151
-
152
-
153
-
154
-
155
-
156
-
157
-
158
-
159
-
160
-
161
-
162
-
163
-
164
-
165
-
166
-
167
-
168
-
169
-
170
-
171
-
172
-
173
-
174
-
175
-
176
-
177
-
178
-
179
-
180
-
181
-
182
-
183
-
184
-
185
-
186
-
187
-
188
-
189
-
190
-
191
-
192
-
193
-
194
-
195
-
196
-
197
-
198
-
199
-
200
-
201
-
202
-
203
-
204
-
205
-
206
-
207
-
208
-
209
-
210
-
211
-
212
-
213
-
214
-
215
-
216
-
217
-
218
-
219
-
220
-
221
-
222
-
223
-
224
-
225
-
226
-
227
-
228
-
229
-
230
-
231
-
232
-
233
-
234
-
235
-
236
-
237
-
238
-
239
-
240
-
241
-
242
-
243
-
244
-
245
-
246
-
247
-
248
-
249
-
250
-
251
-
252
-
253
-
254
-
255
-
256
-
257
-
258
 |
 |

121
exposure requires the insured to “prove” not only claims under the policy, but also the prior payment of
claims reaching up to the excess policy’s attachment point.
Examples of common risk factors that can change and, thus, affect the required International and
other reserves (beyond those included in the general discussion section)include:
International and other risk factors
Changes in claim handlingprocedures, including those of the primary carriers
Changes in policy provisions or court interpretation of such provision
New theories of liability
Trends in jury awards
Changes in the propensity to sue
Changes in statutes of limitations
Changes in the underlying court system
Distortions from losses resulting from large single accounts or single issues
Changes in tort law
Changes in claim adjuster office structure (causing distortions in the data)
International and other book of business risk factors
Changes in policy provisions (e.g., deductibles, policy limits, endorsements, “claims made” language)
Changes in underwriting standards
Product mix (e.g., size of account, industries insured, jurisdiction mix)
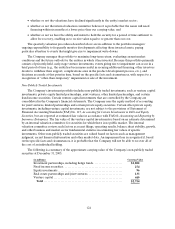
Reinsurance Recoverables
The following table summarizes the composition ofthe Company’s reinsurance recoverable assets:
(at December 31, in millions) 2005 2004
Gross reinsurance recoverables on paid and unpaid claims and
claim adjustment expenses ............................... $ 1 4,177 $ 1 3,367
Allowance for uncollectible reinsurance ..................... (804 )(751 )
Net reinsurance recoverables............................... 13,373 12,616
Mandatory pools and associations. .......................... 2,211 2,497
Structured settlements..................................... 3,990 3,941
Total reinsurance recoverables ............................. $ 1 9,574 $ 1 9,054
The $810 million increase in gross reinsurance recoverables over year-end 2004 was primarily due to
recoverables resulting from Hurricanes Katrina, Rita and Wilma. Amounts recoverable from reinsurers
are estimated in a manner consistent with the associated claim liability. The Company evaluates and
monitors the financial condition of its reinsurers under voluntary reinsurance arrangements to minimize its
exposure to significant losses from reinsurer insolvencies. In addition, in the ordinary course of business,
the Company becomes involved in coverage disputes with its reinsurers. Some of these disputes could
result in lawsuits and arbitrations brought by or against the reinsurers to determine the Company’s rights
and obligations under the various reinsurance agreements. The Company employs dedicated specialists
and aggressive strategies to manage reinsurance collections and disputes.