Travelers 2005 Annual Report Download - page 95
Download and view the complete annual report
Please find page 95 of the 2005 Travelers annual report below. You can navigate through the pages in the report by either clicking on the pages listed below, or by using the keyword search tool below to find specific information within the annual report.-
 1
1 -
2
-
3
-
4
-
5
-
6
-
7
-
8
-
9
-
10
-
11
-
12
-
13
-
14
-
15
-
16
-
17
-
18
-
19
-
20
-
21
-
22
-
23
-
24
-
25
-
26
-
27
-
28
-
29
-
30
-
31
-
32
-
33
-
34
-
35
-
36
-
37
-
38
-
39
-
40
-
41
-
42
-
43
-
44
-
45
-
46
-
47
-
48
-
49
-
50
-
51
-
52
-
53
-
54
-
55
-
56
-
57
-
58
-
59
-
60
-
61
-
62
-
63
-
64
-
65
-
66
-
67
-
68
-
69
-
70
-
71
-
72
-
73
-
74
-
75
-
76
-
77
-
78
-
79
-
80
-
81
-
82
-
83
-
84
-
 85
85 -
 86
86 -
 87
87 -
 88
88 -
 89
89 -
 90
90 -
 91
91 -
 92
92 -
 93
93 -
 94
94 -
 95
95 -
 96
96 -
 97
97 -
 98
98 -
 99
99 -
 100
100 -
 101
101 -
 102
102 -
 103
103 -
 104
104 -
 105
105 -
106
-
107
-
108
-
109
-
110
-
111
-
112
-
113
-
114
-
115
-
116
-
117
-
118
-
119
-
120
-
121
-
122
-
123
-
124
-
125
-
126
-
127
-
128
-
129
-
130
-
131
-
132
-
133
-
134
-
135
-
136
-
137
-
138
-
139
-
140
-
141
-
142
-
143
-
144
-
145
-
146
-
147
-
148
-
149
-
150
-
151
-
152
-
153
-
154
-
155
-
156
-
157
-
158
-
159
-
160
-
161
-
162
-
163
-
164
-
165
-
166
-
167
-
168
-
169
-
170
-
171
-
172
-
173
-
174
-
175
-
176
-
177
-
178
-
179
-
180
-
181
-
182
-
183
-
184
-
185
-
186
-
187
-
188
-
189
-
190
-
191
-
192
-
193
-
194
-
195
-
196
-
197
-
198
-
199
-
200
-
201
-
202
-
203
-
204
-
205
-
206
-
207
-
208
-
209
-
210
-
211
-
212
-
213
-
214
-
215
-
216
-
217
-
218
-
219
-
220
-
221
-
222
-
223
-
224
-
225
-
226
-
227
-
228
-
229
-
230
-
231
-
232
-
233
-
234
-
235
-
236
-
237
-
238
-
239
-
240
-
241
-
242
-
243
-
244
-
245
-
246
-
247
-
248
-
249
-
250
-
251
-
252
-
253
-
254
-
255
-
256
-
257
-
258
 |
 |

83
2004 were down compared with 2003, when renewal rights transactions contributed to strong growth in
new business. The impact of the decline in new business levels in 2004 was partially offset by premium
growth resulting from the transfer of certain business from the Company’s Gulf operation, which was
placed in runoff in the second quarter of the year. In International Specialty, business retention levels in
2004 (excluding Lloyd’s) were strong relative to pre-merger levels, and new business levels were consistent
with the pre-merger levels in 2003. In 2004, the Company continued its focus on retaining its profitable
book of existing International Specialty business. At Lloyd’s, premium volume in 2004 was negatively
impacted by the non-renewal of certain credit-related personal lines insurance coverages.
Personal
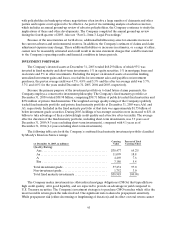
Results of the Company’s Personal segment were as follows:
(for the year ended December 31, in millions) 2005 2004 2003
Revenues:
Earned premiums................................ $6,028 $5,580 $4,822
Net investment income ........................... 457 442 361
Other revenues .................................. 96 91 85
Total revenues................................... $6,581 $6,113 $5,268
Total claims and expenses .......................... $5,464 $4,732 $4,555
Operating income.................................. $ 775 $939 $492
Loss and lossadjustment expense ratio............... 62.2% 58.3 % 69.1 %
Underwriting expense ratio......................... 26.9 24.9 23.7
GAAP combined ratio ............................ 89.1% 83.2 % 92.8 %
Overview
Operating income of $775 million in 2005 was $164 million lower than operating income of
$939 million in 2004, largely due to the $593 million cost of catastrophes primarily resulting from
Hurricanes Katrina, Rita and Wilma in2005, which are discussed in more detail in the “Consolidated
Overview” section herein. The cost of catastrophes in 2004 totaled $189 million, the majority of which
resulted from four hurricanes that struck the southeastern United States. The Personal segment in 2005
benefited from continued low non-catastrophe frequency levels, net favorable prior year reserve
development of $360 million and strong net investmentincome levels. In 2004, the $447 million increase in
operating income over 2003 was driven by low non-catastrophe frequency levels, particularly in the
property line, strong premium growth resulting from unit growth and price increases, and $378 million of
net favorable prior year reserve development. Net favorable prior year development in 2003 totaled
$212 million.
Earned Premiums
Earned premiums of $6.03 billion in 2005 increased $448 million, or 8%, over 2004 earned premiums
of $5.58 billion, reflecting continued strong business retention levels, new business volumes and renewal
price increases over the prior twelve months. Earned premiums in 2005 were reduced by $21 million of
reinstatement premiums described in the “Consolidated Overview” section herein. The $758 million, or
16%, growth in earned premiums in 2004 over 2003 was primarily due to an increase in organic new
business volume, new business associated with the Royal & SunAlliance renewal rights transaction entered
into in the third quarter of 2003, strongbusiness retention levels and renewal price increases over the prior
twelve months.