Travelers 2005 Annual Report Download - page 79
Download and view the complete annual report
Please find page 79 of the 2005 Travelers annual report below. You can navigate through the pages in the report by either clicking on the pages listed below, or by using the keyword search tool below to find specific information within the annual report.-
 1
1 -
2
-
3
-
4
-
5
-
6
-
7
-
8
-
9
-
10
-
11
-
12
-
13
-
14
-
15
-
16
-
17
-
18
-
19
-
20
-
21
-
22
-
23
-
24
-
25
-
26
-
27
-
28
-
29
-
30
-
31
-
32
-
33
-
34
-
35
-
36
-
37
-
38
-
39
-
40
-
41
-
42
-
43
-
44
-
45
-
46
-
47
-
48
-
49
-
50
-
51
-
52
-
53
-
54
-
55
-
56
-
57
-
58
-
59
-
60
-
61
-
62
-
63
-
64
-
65
-
66
-
67
-
68
-
 69
69 -
 70
70 -
 71
71 -
 72
72 -
 73
73 -
 74
74 -
 75
75 -
 76
76 -
 77
77 -
 78
78 -
 79
79 -
 80
80 -
 81
81 -
 82
82 -
 83
83 -
 84
84 -
 85
85 -
 86
86 -
 87
87 -
 88
88 -
 89
89 -
90
-
91
-
92
-
93
-
94
-
95
-
96
-
97
-
98
-
99
-
100
-
101
-
102
-
103
-
104
-
105
-
106
-
107
-
108
-
109
-
110
-
111
-
112
-
113
-
114
-
115
-
116
-
117
-
118
-
119
-
120
-
121
-
122
-
123
-
124
-
125
-
126
-
127
-
128
-
129
-
130
-
131
-
132
-
133
-
134
-
135
-
136
-
137
-
138
-
139
-
140
-
141
-
142
-
143
-
144
-
145
-
146
-
147
-
148
-
149
-
150
-
151
-
152
-
153
-
154
-
155
-
156
-
157
-
158
-
159
-
160
-
161
-
162
-
163
-
164
-
165
-
166
-
167
-
168
-
169
-
170
-
171
-
172
-
173
-
174
-
175
-
176
-
177
-
178
-
179
-
180
-
181
-
182
-
183
-
184
-
185
-
186
-
187
-
188
-
189
-
190
-
191
-
192
-
193
-
194
-
195
-
196
-
197
-
198
-
199
-
200
-
201
-
202
-
203
-
204
-
205
-
206
-
207
-
208
-
209
-
210
-
211
-
212
-
213
-
214
-
215
-
216
-
217
-
218
-
219
-
220
-
221
-
222
-
223
-
224
-
225
-
226
-
227
-
228
-
229
-
230
-
231
-
232
-
233
-
234
-
235
-
236
-
237
-
238
-
239
-
240
-
241
-
242
-
243
-
244
-
245
-
246
-
247
-
248
-
249
-
250
-
251
-
252
-
253
-
254
-
255
-
256
-
257
-
258
 |
 |
67
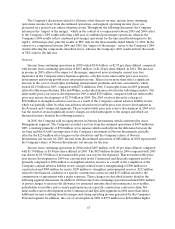
The Company’s discussions related to all items, other than net income, income from continu ing
operations, income (loss) from discontinued operations, and segment operating income (loss), are
presented on a pretax basis, unless otherwise noted. Throughout the following discussion, the Company
references the “impact of the merger,” which in the context of a comparison between 2005 and 2004 refers
to the Company’s 2005 results reflecting a full year of combined post-merger operations, whereas the
Company’s 2004 results reflect combined post-merger operations for the nine months subsequent to the
April 1, 2004 merger date, plus the results of TPC only for the three months ended March 31, 2004. In the
context of a comparison between 2004 and 2003, the “impact of the merger” refers to the Company’s 2004
results reflecting the components described above, whereas the Company’s 2003 results include the results
of TPC only for the full year.
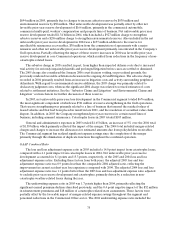
Overview
Income from continuingoperations in 2005 totaled $2.06 billion, or $2.95 per share diluted, compared
with income from continuing operations of $867 million, or $1.40 per share diluted, in 2004. The increase
in income in 2005 reflected the impact of the merger, improved non-catastrophe current year loss
experience in the Company’s three business segments, a decline in net unfavorable prior year reserve
development and strong growth in net investment income. These factors more than offset a significant
increase in the cost of catastrophes (including reinstatement premiums and state assessments), which
totaled $2.19 billion in 2005, compared with $772 million in2004. Catastrophe losses in 2005 primarily
related to Hurricanes Katrina, Rita and Wilma, as described in more detail in the following narrative. Net
unfavorable prior year reserve development in 2005 totaled $325 million, compared with net unfavorable
prior year reserve development of $2.39 billion in 2004. The 2005 total was driven by a charge of
$830 million to strengthen asbestos reserves as a result of the Company’s annual asbestos liability review,
which was partially offset by other non-asbestos related net favorable prior year reserve development in
the Personal and Commercial segments. The net unfavorable prior year reserve development in 2004 total
was the result of several significant reserve charges recorded subsequent to the merger and which are
discussed in more detail in the following narrative.
In 2005, the Company sold its equity interest in Nuveen Investments, which constituted its Asset
Management segment. The Company recorded a net loss from discontinued operationsof $439 million in
2005, consisting primarily of $710 million of tax expense which resulted from the difference between the
tax basis and the GAAP carrying value of the Company’s investmentin Nuveen Investments, partially
offset by the $224 million after-tax gain on the divestiture and the Company’s share of Nuveen
Investments’ net income for 2005. Income from discontinued operations of $88 million in 2004 represented
the Company’s share of Nuveen Investments’ net income for the year.
Income from continuingoperations in 2004 totaled $867 million, or $1.40 per share diluted, compared
with $1.70 billion, or $3.80 per share diluted, in 2003. The $829 million decline in 2004 compared with 2003
wasdriven by $2.39 billion of net unfavorable prior-year reserve development. That net unfavorable prior
year reserve development in 2004 was concentrated in the Commercial and Specialty segments and was
primarily comprised of $928 million to strengthen asbestos reserves as a result of the completion of the
Company’s annual asbestos liability review, merger-related reserve strengthening of $500 million for
construction and $300 million for surety, $290million to strengthen environmental reserves, $252 million
related to the financial condition of a specific construction contractor and $113 million related to the
commutation of agreements with a major reinsurer. These charges are described in more detail in the
following segment discussions. In addition, 2004 income from continuing operations included $296 million
of pretax charges to increase the allowance for estimated amounts due from reinsurance recoverables,
policyholder receivables and co-surety participations on a specific construction contractor claim. Net
unfavorable reserve development in the Commercial and Specialty segments in 2004 more than offset
additional income resulting from the merger and strongoperating income generated by the Company’s
Personal segment. In addition, the cost of catastrophes in 2004 of $772 million was $420 million higher