Travelers 2005 Annual Report Download - page 93
Download and view the complete annual report
Please find page 93 of the 2005 Travelers annual report below. You can navigate through the pages in the report by either clicking on the pages listed below, or by using the keyword search tool below to find specific information within the annual report.-
 1
1 -
2
-
3
-
4
-
5
-
6
-
7
-
8
-
9
-
10
-
11
-
12
-
13
-
14
-
15
-
16
-
17
-
18
-
19
-
20
-
21
-
22
-
23
-
24
-
25
-
26
-
27
-
28
-
29
-
30
-
31
-
32
-
33
-
34
-
35
-
36
-
37
-
38
-
39
-
40
-
41
-
42
-
43
-
44
-
45
-
46
-
47
-
48
-
49
-
50
-
51
-
52
-
53
-
54
-
55
-
56
-
57
-
58
-
59
-
60
-
61
-
62
-
63
-
64
-
65
-
66
-
67
-
68
-
69
-
70
-
71
-
72
-
73
-
74
-
75
-
76
-
77
-
78
-
79
-
80
-
81
-
82
-
 83
83 -
 84
84 -
 85
85 -
 86
86 -
 87
87 -
 88
88 -
 89
89 -
 90
90 -
 91
91 -
 92
92 -
 93
93 -
 94
94 -
 95
95 -
 96
96 -
 97
97 -
 98
98 -
 99
99 -
 100
100 -
 101
101 -
 102
102 -
 103
103 -
104
-
105
-
106
-
107
-
108
-
109
-
110
-
111
-
112
-
113
-
114
-
115
-
116
-
117
-
118
-
119
-
120
-
121
-
122
-
123
-
124
-
125
-
126
-
127
-
128
-
129
-
130
-
131
-
132
-
133
-
134
-
135
-
136
-
137
-
138
-
139
-
140
-
141
-
142
-
143
-
144
-
145
-
146
-
147
-
148
-
149
-
150
-
151
-
152
-
153
-
154
-
155
-
156
-
157
-
158
-
159
-
160
-
161
-
162
-
163
-
164
-
165
-
166
-
167
-
168
-
169
-
170
-
171
-
172
-
173
-
174
-
175
-
176
-
177
-
178
-
179
-
180
-
181
-
182
-
183
-
184
-
185
-
186
-
187
-
188
-
189
-
190
-
191
-
192
-
193
-
194
-
195
-
196
-
197
-
198
-
199
-
200
-
201
-
202
-
203
-
204
-
205
-
206
-
207
-
208
-
209
-
210
-
211
-
212
-
213
-
214
-
215
-
216
-
217
-
218
-
219
-
220
-
221
-
222
-
223
-
224
-
225
-
226
-
227
-
228
-
229
-
230
-
231
-
232
-
233
-
234
-
235
-
236
-
237
-
238
-
239
-
240
-
241
-
242
-
243
-
244
-
245
-
246
-
247
-
248
-
249
-
250
-
251
-
252
-
253
-
254
-
255
-
256
-
257
-
258
 |
 |
81
paid amounts, net receivables, liquidated damages, overhead costs, additional completion costs, including
costs associated with replacing the contractor, receivable discounts, current and future claims from owners
and subcontractors against the contractor, and the value of collateral, among others.
Also during the last half of the second quarter of 2004, a participating co-surety on this exposure
announced that insurance regulators had approvedits submitted run-off plan. Based upon industry’s
knowledge of the co-surety’s run-off plan and the Company’s analysis of its financial condition, the
Company concluded that it was unlikely to collect the full amount projected to be owed by the co-surety
and established an appropriate level of reserves. In the second quarter of 2005, the Company reached a
settlement with the co-surety whereby the co-surety made a payment to the Company and was released
from further financial obligations to theCompany inconnection withthe specific constructionexposure.
The settlement payment, coupled with the previously established co-surety reserves, approximated the
current estimate of the co-surety’s share of the bonded losses related to this exposure.
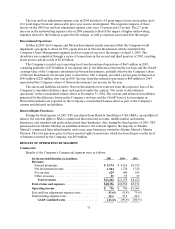
Claim and claim adjustmentexpenses in 2004 included $209 million of catastrophe losses, compared
with no such losses in 2003. Results in 2004 also reflected increased current year loss ratios on portions of
the Bond and Construction books of business, and $150 million of unfavorable prior year reserve
development recorded in TPC’s Construction operation prior to the merger.
General and administrativeexpenses in 2005 totaled $893 million, an increase of 15% over the 2004
total of $779 million which primarily reflected the impact of the merger. The 2005 total included the
impacts of a decline in commission expenses and expense efficiencies realized as a result of the merger. In
2004, general and administrative expenses of $779 million were significantly higher than the 2003 total of
$222 million, reflecting the impact of the merger.
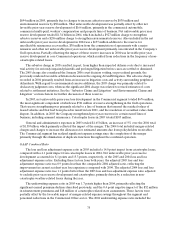
Other items increasing 2004 claims and expenses compared to 2003 include $217 million of charges to
increase the allowances for estimated amounts due from reinsurance recoverables, policyholders
receivables, and the co-surety on a specific construction contractor claim described above.
GAAP Combined Ratio
The loss and loss adjustment expense ratio in 2005 included a 5.8 point impact from catastrophe
losses, whereas the comparable 2004 ratio included a 4.6 point impact from catastrophe losses. The loss
and loss adjustment expense ratio for 2005 also included a 0.1 point benefit from net favorable prior year
reserve development, whereas the comparable 2004 ratio impact from net unfavorable prior year reserve
development totaled 30.8 points. Excluding both factors in each year, the 2005 loss and loss adjustment
expense ratio improved over the 2004 ratio, reflecting the significant improvement in current year loss
experience in 2005. The impact of prior year reserve development and catastrophe losses in2003was
negligible.
The 2005 underwriting expense ratio improved 1.7 points compared with 2004, reflecting the impact of
the merger and expense efficiencies realized since the completion of the merger. The 2004 underwriting
expense ratio was also negatively impacted by an increase to the allowance for estimated amounts due
from policyholder receivables and merger-related restructuring costs.