Travelers 2005 Annual Report Download - page 33
Download and view the complete annual report
Please find page 33 of the 2005 Travelers annual report below. You can navigate through the pages in the report by either clicking on the pages listed below, or by using the keyword search tool below to find specific information within the annual report.-
 1
1 -
2
-
3
-
4
-
5
-
6
-
7
-
8
-
9
-
10
-
11
-
12
-
13
-
14
-
15
-
16
-
17
-
18
-
19
-
20
-
21
-
22
-
 23
23 -
 24
24 -
 25
25 -
 26
26 -
 27
27 -
 28
28 -
 29
29 -
 30
30 -
 31
31 -
 32
32 -
 33
33 -
 34
34 -
 35
35 -
 36
36 -
 37
37 -
 38
38 -
 39
39 -
 40
40 -
 41
41 -
 42
42 -
 43
43 -
44
-
45
-
46
-
47
-
48
-
49
-
50
-
51
-
52
-
53
-
54
-
55
-
56
-
57
-
58
-
59
-
60
-
61
-
62
-
63
-
64
-
65
-
66
-
67
-
68
-
69
-
70
-
71
-
72
-
73
-
74
-
75
-
76
-
77
-
78
-
79
-
80
-
81
-
82
-
83
-
84
-
85
-
86
-
87
-
88
-
89
-
90
-
91
-
92
-
93
-
94
-
95
-
96
-
97
-
98
-
99
-
100
-
101
-
102
-
103
-
104
-
105
-
106
-
107
-
108
-
109
-
110
-
111
-
112
-
113
-
114
-
115
-
116
-
117
-
118
-
119
-
120
-
121
-
122
-
123
-
124
-
125
-
126
-
127
-
128
-
129
-
130
-
131
-
132
-
133
-
134
-
135
-
136
-
137
-
138
-
139
-
140
-
141
-
142
-
143
-
144
-
145
-
146
-
147
-
148
-
149
-
150
-
151
-
152
-
153
-
154
-
155
-
156
-
157
-
158
-
159
-
160
-
161
-
162
-
163
-
164
-
165
-
166
-
167
-
168
-
169
-
170
-
171
-
172
-
173
-
174
-
175
-
176
-
177
-
178
-
179
-
180
-
181
-
182
-
183
-
184
-
185
-
186
-
187
-
188
-
189
-
190
-
191
-
192
-
193
-
194
-
195
-
196
-
197
-
198
-
199
-
200
-
201
-
202
-
203
-
204
-
205
-
206
-
207
-
208
-
209
-
210
-
211
-
212
-
213
-
214
-
215
-
216
-
217
-
218
-
219
-
220
-
221
-
222
-
223
-
224
-
225
-
226
-
227
-
228
-
229
-
230
-
231
-
232
-
233
-
234
-
235
-
236
-
237
-
238
-
239
-
240
-
241
-
242
-
243
-
244
-
245
-
246
-
247
-
248
-
249
-
250
-
251
-
252
-
253
-
254
-
255
-
256
-
257
-
258
 |
 |
21
The Company derives estimates for unreported claims and development on reported claims
principally from actuarial analyses of historical patterns of loss development by accident year for each type
of exposure and business unit. Similarly, the Company derives estimates of unpaid loss adjustment
expenses principally from actuarial analyses of historical development patterns of the relationship of loss
adjustment expenses to losses for each line of business and type of exposure. For a description of the
Company’s reserving methods for asbestos and environmental claims, see “Item 7—Asbestos Claims and
Litigation,” and “Environmental Claims and Litigation.”
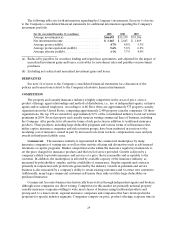
Discounting
Included in the claims and claim adjustment expense reserves in the consolidated balance sheet are
certain reserves discounted to the present value of estimated future payments. The liabilities for losses for
some long-term disability payments under workers’ compensation insurance and workers’ compensation
excess insurance, which totaled $1.92 billion and $1.99 billionat December 31, 2005 and 2004, respectively,
were discounted using a rate of 5% at December 31, 2005 and a range of rates from 3.5% to 5% at
December 31, 2004. Reserves related to certain fixed and determinable asbestos-related settlements, where
all payment amounts and their timing are known, totaled $34 million and $67 million at December 31, 2005
and 2004, respectively. These reserves were discounted using a rate of 2.6% at December 31, 2005, and at a
range of rates from 2.3% to 2.6% at December 31, 2004. Reserves for certain assumed reinsurance
business were discounted using a range of rates from 5% to 7.5%, and totaled $79 million and $126 million
at December 31, 2005 and 2004, respectively.
Other Factors
The table on page 23 sets forth the year-end reserves from 1995 through 2005 and the subsequent
changes in those reserves, presented on a historical basis. The original estimates, cumulative amounts paid
and reestimated reserves in the table for the years 1995 through2003 have not been restated to reflect the
acquisition of SPC in 2004. The table includes SPC reserves beginning at December 31, 2004.
The original estimates, cumulative amounts paid and reestimated reserves in the table for the years
1995 to 2000 have also not been restated to reflect the acquisition of Northland and Commercial Guaranty
Casualty, and the year 1995 in the table has not been restated to reflect the acquisition of Aetna’s property
and casualty insurance subsidiaries. Beginning in 1996 and 2001, the table includes the reserve activity of
Aetna’s property and casualty insurance subsidiaries, and Northland and Commercial Guaranty Casualty,
respectively. The data in the table is presented in accordance with reporting requirements of the Securities
and Exchange Commission(SEC). Care must be taken to avoid misinterpretation by those unfamiliar with
this informationor familiar with other data commonly reported by the insurance industry. The
accompanying data is not accident year data, but rather a display of 1995 to 2005 year-end reserves and the
subsequent changes in those reserves.
For instance, the “cumulative deficiency or redundancy” shown in the accompanying table for each
year represents the aggregate amountby which original estimates of reserves as of that year end have
changed in subsequent years. Accordingly, the cumulative deficiency for a year relates only to reserves at
that year-end and those amounts are not additive. Expressed another way, if the original reserves at the
end of 1995 included $4 million for a loss that is finally paid in 2005 for $5 million, the $1 million deficiency
(the excess of the actual payment of $5 million over the original estimate of $4 million) would be included
in the cumulative deficiencies in each of the years 1995 to 2004 shown in the accompanying table.
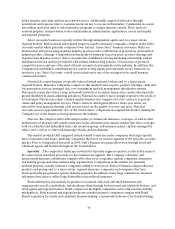
Various factors may distort the re-estimated reserves and cumulative deficiency or redundancy shown
in the accompanying table. For example, a substantial portion of the cumulativedeficiencies shown in the
accompanying table arise from claims on policies written prior to the mid-1970s involving liability
exposures such as asbestos and environmental claims. In the post-1984 period,the Company has developed
more stringent underwriting standards and policy exclusions and has significantly contracted or terminated