Travelers 2005 Annual Report Download - page 177
Download and view the complete annual report
Please find page 177 of the 2005 Travelers annual report below. You can navigate through the pages in the report by either clicking on the pages listed below, or by using the keyword search tool below to find specific information within the annual report.-
 1
1 -
2
-
3
-
4
-
5
-
6
-
7
-
8
-
9
-
10
-
11
-
12
-
13
-
14
-
15
-
16
-
17
-
18
-
19
-
20
-
21
-
22
-
23
-
24
-
25
-
26
-
27
-
28
-
29
-
30
-
31
-
32
-
33
-
34
-
35
-
36
-
37
-
38
-
39
-
40
-
41
-
42
-
43
-
44
-
45
-
46
-
47
-
48
-
49
-
50
-
51
-
52
-
53
-
54
-
55
-
56
-
57
-
58
-
59
-
60
-
61
-
62
-
63
-
64
-
65
-
66
-
67
-
68
-
69
-
70
-
71
-
72
-
73
-
74
-
75
-
76
-
77
-
78
-
79
-
80
-
81
-
82
-
83
-
84
-
85
-
86
-
87
-
88
-
89
-
90
-
91
-
92
-
93
-
94
-
95
-
96
-
97
-
98
-
99
-
100
-
101
-
102
-
103
-
104
-
105
-
106
-
107
-
108
-
109
-
110
-
111
-
112
-
113
-
114
-
115
-
116
-
117
-
118
-
119
-
120
-
121
-
122
-
123
-
124
-
125
-
126
-
127
-
128
-
129
-
130
-
131
-
132
-
133
-
134
-
135
-
136
-
137
-
138
-
139
-
140
-
141
-
142
-
143
-
144
-
145
-
146
-
147
-
148
-
149
-
150
-
151
-
152
-
153
-
154
-
155
-
156
-
157
-
158
-
159
-
160
-
161
-
162
-
163
-
164
-
165
-
166
-
 167
167 -
 168
168 -
 169
169 -
 170
170 -
 171
171 -
 172
172 -
 173
173 -
 174
174 -
 175
175 -
 176
176 -
 177
177 -
 178
178 -
 179
179 -
 180
180 -
 181
181 -
 182
182 -
 183
183 -
 184
184 -
 185
185 -
 186
186 -
 187
187 -
188
-
189
-
190
-
191
-
192
-
193
-
194
-
195
-
196
-
197
-
198
-
199
-
200
-
201
-
202
-
203
-
204
-
205
-
206
-
207
-
208
-
209
-
210
-
211
-
212
-
213
-
214
-
215
-
216
-
217
-
218
-
219
-
220
-
221
-
222
-
223
-
224
-
225
-
226
-
227
-
228
-
229
-
230
-
231
-
232
-
233
-
234
-
235
-
236
-
237
-
238
-
239
-
240
-
241
-
242
-
243
-
244
-
245
-
246
-
247
-
248
-
249
-
250
-
251
-
252
-
253
-
254
-
255
-
256
-
257
-
258
 |
 |

THE ST. PAUL TRAVELERS COMPANIES, INC.AND SUBSIDIARIES
NOTES TO CONSOLIDATED FINANCIAL STATEMENTS (Continued)
165
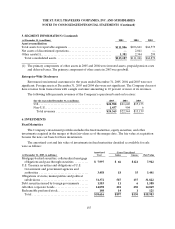
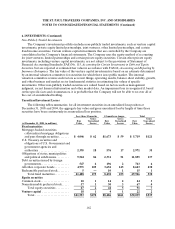
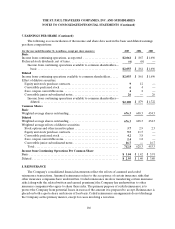
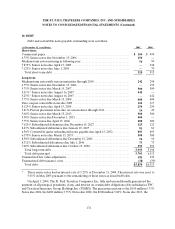
6. INVESTMENTS (Continued)
Changes in net unrealized gains (losses) on investment securities that are included as a separate
component of accumulated other changes in equity from nonownersources were as follows:
(at and for the year ended December 31, in millions) 2005 2004 2003
Change in net unrealized investment gains (losses)
Fixed maturities...................................................... $ ( 885) $ (315 ) $ 442
Equity securities ..................................................... (31 )11 70
Venture capital and other............................................. 64
14 —
(852 )(290 ) 512
Related taxes........................................................ (311 )(98 ) 183
Minority interest..................................................... — — (1)
Change in net unrealized gains (losses) on investment securities.......... (541 )(192 ) 328
Balance, beginningof year. ............................................ 868 1,060 732
Balance, end of year................................................ $327
$868 $1,060
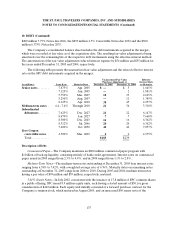
7. EARNINGS PER SHARE
Earnings per share (EPS) was computed in accordance with Statement of Financial Accounting
Standards No. 128, Earnings per Share (FAS 128). Basic EPS was computed by dividing income available to
common shareholders by the weighted average number of common shares outstanding during the period.
The computation of diluted EPS reflected the effect of potentially dilutive securities.
The weighted average number of common shares outstanding applicable to basic and diluted EPS for
all periods prior to April 1, 2004 were restated to reflect the exchange of each share of TPC common stock
for 0.4334 shares of the Company’s common stock.
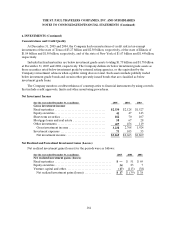
In 2004, the Company implemented the provisions of FASB EITF 04-8, The Effect of Contingently
Convertible Debt on Diluted Earningsper Share, which provided new guidance on the dilutive effect of
contingently convertible debt instruments. The Company has one debt instrument outstanding towhich the
new guidance applied—its $893 million, 4.50% convertible junior subordinated notes convertible into 16.7
million shares of the Company’s common stock. Income from continuing operationsper diluted share for
the year ended December 31, 2004 excluded the weighted average effects of these notes as the impact
would have been anti-dilutive. For the year ended December 31, 2003, the application of the new guidance
resulted in the restatement of diluted income from continuing operations per share from the previously
reported $3.88 to $3.80.