Travelers 2005 Annual Report Download - page 174
Download and view the complete annual report
Please find page 174 of the 2005 Travelers annual report below. You can navigate through the pages in the report by either clicking on the pages listed below, or by using the keyword search tool below to find specific information within the annual report.-
 1
1 -
2
-
3
-
4
-
5
-
6
-
7
-
8
-
9
-
10
-
11
-
12
-
13
-
14
-
15
-
16
-
17
-
18
-
19
-
20
-
21
-
22
-
23
-
24
-
25
-
26
-
27
-
28
-
29
-
30
-
31
-
32
-
33
-
34
-
35
-
36
-
37
-
38
-
39
-
40
-
41
-
42
-
43
-
44
-
45
-
46
-
47
-
48
-
49
-
50
-
51
-
52
-
53
-
54
-
55
-
56
-
57
-
58
-
59
-
60
-
61
-
62
-
63
-
64
-
65
-
66
-
67
-
68
-
69
-
70
-
71
-
72
-
73
-
74
-
75
-
76
-
77
-
78
-
79
-
80
-
81
-
82
-
83
-
84
-
85
-
86
-
87
-
88
-
89
-
90
-
91
-
92
-
93
-
94
-
95
-
96
-
97
-
98
-
99
-
100
-
101
-
102
-
103
-
104
-
105
-
106
-
107
-
108
-
109
-
110
-
111
-
112
-
113
-
114
-
115
-
116
-
117
-
118
-
119
-
120
-
121
-
122
-
123
-
124
-
125
-
126
-
127
-
128
-
129
-
130
-
131
-
132
-
133
-
134
-
135
-
136
-
137
-
138
-
139
-
140
-
141
-
142
-
143
-
144
-
145
-
146
-
147
-
148
-
149
-
150
-
151
-
152
-
153
-
154
-
155
-
156
-
157
-
158
-
159
-
160
-
161
-
162
-
163
-
 164
164 -
 165
165 -
 166
166 -
 167
167 -
 168
168 -
 169
169 -
 170
170 -
 171
171 -
 172
172 -
 173
173 -
 174
174 -
 175
175 -
 176
176 -
 177
177 -
 178
178 -
 179
179 -
 180
180 -
 181
181 -
 182
182 -
 183
183 -
 184
184 -
185
-
186
-
187
-
188
-
189
-
190
-
191
-
192
-
193
-
194
-
195
-
196
-
197
-
198
-
199
-
200
-
201
-
202
-
203
-
204
-
205
-
206
-
207
-
208
-
209
-
210
-
211
-
212
-
213
-
214
-
215
-
216
-
217
-
218
-
219
-
220
-
221
-
222
-
223
-
224
-
225
-
226
-
227
-
228
-
229
-
230
-
231
-
232
-
233
-
234
-
235
-
236
-
237
-
238
-
239
-
240
-
241
-
242
-
243
-
244
-
245
-
246
-
247
-
248
-
249
-
250
-
251
-
252
-
253
-
254
-
255
-
256
-
257
-
258
 |
 |

THE ST. PAUL TRAVELERS COMPANIES, INC.AND SUBSIDIARIES
NOTES TO CONSOLIDATED FINANCIAL STATEMENTS (Continued)
162
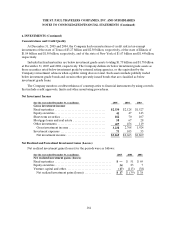
6. INVESTMENTS (Continued)
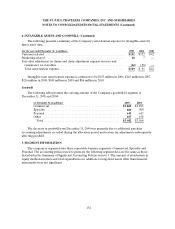
Non-Publicly TradedInvestments
The Company’s investmentportfolio includes non-publicly traded investments, such as venture capital
investments, private equity limited partnerships, joint ventures, other limited partnerships, and certain
fixed income securities. Certain venture capital investments that are controlled by the Company are
consolidated in the Company’s financial statements. The Company uses the equity method of accounting
for joint ventures, limited partnerships and certain private equity securities. Certain other private equity
investments,including venture capital investments, are not subject to the provisions of Statement of
Financial Accounting Standards (FAS) No. 115, Accounting for Certain Investments in Debt and Equity
Securities, but are reported at estimated fair value in accordance with FAS 60, Accounting and Reporting by
Insurance Enterprises. The fair value of the venture capital investments is based on an estimate determined
by an internal valuation committee for securities for which there is no public market. The internal
valuation committee reviews such factors as recent filings, operating results, balance sheet stability, growth,
and other business and market sector fundamental statistics in estimating fair values of specific
investments. Other non-publicly traded securities are valued based on factors such as management
judgment, recent financial information and other market data. An impairment loss is recognized if, based
on the specific facts and circumstances, it is probable that the Company will not be able to recover all of
the cost of an individual holding.
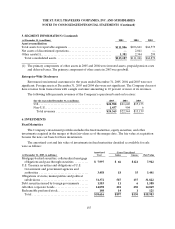
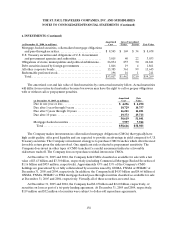
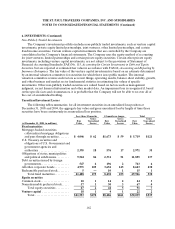
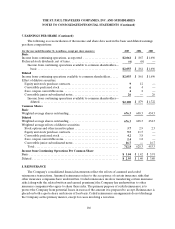
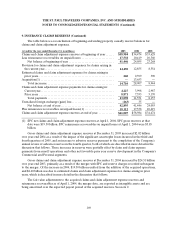
Unrealized Investment Losses
The following tables summarize, for all investment securities in an unrealized loss position at
December 31, 2005 and 2004, the aggregate fair value and gross unrealized loss by length of time those
securities have been continuously in an unrealized loss position.
Less than12 months 12 months or longer Total
(at December 31, 2005, in millions)
Fair
Value
Gross
Unrealized
Losses
Fair
Value
Gross
Unrealized
Losses
Fair
Value
Gross
Unrealized
Losses
Fixed maturities
Mortgage-backed securities,
collateralized mortgage obligations
and pass through securities ....... $ 4,046 $ 62 $1,673 $59 $5,719 $ 121
U.S. Treasury securities and
obligations of U.S. Government and
government agencies and
authorities ..................... 2,395 18 576 17 2,971 35
Obligations of states, municipalities
and political subdivisions ......... 9,524 86 2,331 51 11,855 137
Debt securities issued by foreign
governments. ................... 547 4 196 2 743 6
All other corporate bonds .......... 4,971 105 3,652 125 8,623 230
Redeemable preferredstock ........ 5 — 10 1 15 1
Total fixed maturities .......... 21,488 275 8,438 255 29,926 530
Equity securities
Common stock. ................... 101 14 2 24 3
Nonredeemable preferred stock. .... 371 30 3 67 4
Total equity securities ......... 472 44 5 91 7
Venture capital................... 181 4 1 22 2
Total........................ $ 21,553 $ 278 $8,486 $261 $ 30,039 $ 5 39