Travelers 2005 Annual Report Download - page 86
Download and view the complete annual report
Please find page 86 of the 2005 Travelers annual report below. You can navigate through the pages in the report by either clicking on the pages listed below, or by using the keyword search tool below to find specific information within the annual report.-
 1
1 -
2
-
3
-
4
-
5
-
6
-
7
-
8
-
9
-
10
-
11
-
12
-
13
-
14
-
15
-
16
-
17
-
18
-
19
-
20
-
21
-
22
-
23
-
24
-
25
-
26
-
27
-
28
-
29
-
30
-
31
-
32
-
33
-
34
-
35
-
36
-
37
-
38
-
39
-
40
-
41
-
42
-
43
-
44
-
45
-
46
-
47
-
48
-
49
-
50
-
51
-
52
-
53
-
54
-
55
-
56
-
57
-
58
-
59
-
60
-
61
-
62
-
63
-
64
-
65
-
66
-
67
-
68
-
69
-
70
-
71
-
72
-
73
-
74
-
75
-
 76
76 -
 77
77 -
 78
78 -
 79
79 -
 80
80 -
 81
81 -
 82
82 -
 83
83 -
 84
84 -
 85
85 -
 86
86 -
 87
87 -
 88
88 -
 89
89 -
 90
90 -
 91
91 -
 92
92 -
 93
93 -
 94
94 -
 95
95 -
 96
96 -
97
-
98
-
99
-
100
-
101
-
102
-
103
-
104
-
105
-
106
-
107
-
108
-
109
-
110
-
111
-
112
-
113
-
114
-
115
-
116
-
117
-
118
-
119
-
120
-
121
-
122
-
123
-
124
-
125
-
126
-
127
-
128
-
129
-
130
-
131
-
132
-
133
-
134
-
135
-
136
-
137
-
138
-
139
-
140
-
141
-
142
-
143
-
144
-
145
-
146
-
147
-
148
-
149
-
150
-
151
-
152
-
153
-
154
-
155
-
156
-
157
-
158
-
159
-
160
-
161
-
162
-
163
-
164
-
165
-
166
-
167
-
168
-
169
-
170
-
171
-
172
-
173
-
174
-
175
-
176
-
177
-
178
-
179
-
180
-
181
-
182
-
183
-
184
-
185
-
186
-
187
-
188
-
189
-
190
-
191
-
192
-
193
-
194
-
195
-
196
-
197
-
198
-
199
-
200
-
201
-
202
-
203
-
204
-
205
-
206
-
207
-
208
-
209
-
210
-
211
-
212
-
213
-
214
-
215
-
216
-
217
-
218
-
219
-
220
-
221
-
222
-
223
-
224
-
225
-
226
-
227
-
228
-
229
-
230
-
231
-
232
-
233
-
234
-
235
-
236
-
237
-
238
-
239
-
240
-
241
-
242
-
243
-
244
-
245
-
246
-
247
-
248
-
249
-
250
-
251
-
252
-
253
-
254
-
255
-
256
-
257
-
258
 |
 |
74
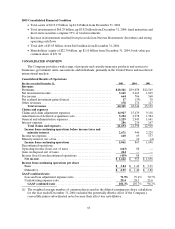
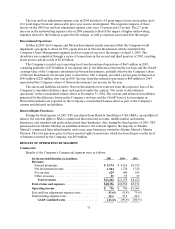
Overview
Operating income of $756 millionin 2005 was 4% lower than operating income of $786 million in 2004,
as the significant increase in the cost of catastrophes in 2005 was substantially offset by a decline in net
unfavorable prior year reserve development and the impact of the merger. The cost of catastrophes totaled
$1.24 billion in2005, compared with $363 million in 2004. Catastrophes in both years were the result of the
hurricanes described in the “Consolidated Overview” section herein. Net unfavorable prior year development
totaled $694million in 2005, compared with $1.34 billion in2004. The totals in both years were primarily
driven by charges to increase asbestos reserves.
Operating income of $786 millionin 2004 declined $275 million, or 26%, from 2003. The decline was
driven by net unfavorable prior year reserve development of $1.34 billion in 2004, primarily related to
asbestos and environmental reserve strengthening. Net unfavorable prior year reserve development totaled
$676 million in 2003, primarily related to reserve strengthening in the Gulf operation due to a line of business
that insured the residual values of leased vehicles. Operating income in2004 also included $363 million for
the cost of catastrophes, compared with $103 million in 2003.
Earned Premiums
The $242 million decline in earned premiums in 2005 compared with 2004 reflected a significant decline
in runoff operations, where business is intentionally being non-renewed, and a decline in ongoing operations
due to a lower level of written premium volume in the last half of 2004 and first half of 2005. These declines
were partially offset by the impact of the merger. In addition, the reinstatement premiums described in the
“Consolidated Overview” section herein reduced net earned premium volume in 2005 by $52 million. In 2004,
earned premium growth of $2.26 billion over 2003 was primarily due to the merger and also reflected the
earned premium effect of moderating renewal price increases over the previous twelve monthsin the
Company’s ongoing Commercial business lines. In addition, incremental premiums resulting from the
renewal rights transactionswith Royal & SunAlliance and Atlantic Mutual in the third quarter of 2003
contributed to premium growth in2004.
Net Investment Income
Refer to the “Net Investment Income” section of the “Consolidated Results of Operations” discussion
herein for a description of the factors contributing to the increase in the Company’s net investment income in
2005 and 2004.
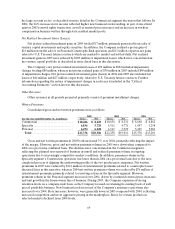
Fee Income
National Accounts is the primary source of fee income due to its service businesses, which include claim
and loss prevention services to large companies that choose to self-insure a portion of their insurance risks,
and claims and policy management services to workers’ compensation residual market pools, automobile
assigned risk plans and to self-insurance pools. The $51 million, or 8%, decline in fee income in 2005
compared with 2004 was primarily due to increased competition, including the loss of several large customers
in the secondhalf of 2004 and in early 2005. The strong increase in 2004 fee income over 2003 reflected
higher new business levels, resulting, in part, from the third quarter 2003 renewal rights transaction with
Royal & SunAlliance, renewal price increases and more workers’ compensation business being written by
state residual market pools.
Claims and Expenses
Claims and claim adjustment expenses in 2005 totaled $7.45 billion, compared with $7.52 billion in 2004.
Included in those totals were $1.17 billion and $363 million, respectively, of catastrophe losses (net of
reinsurance). Net unfavorable prior year reserve development in the Commercial segment totaled