Travelers 2005 Annual Report Download - page 85
Download and view the complete annual report
Please find page 85 of the 2005 Travelers annual report below. You can navigate through the pages in the report by either clicking on the pages listed below, or by using the keyword search tool below to find specific information within the annual report.-
 1
1 -
2
-
3
-
4
-
5
-
6
-
7
-
8
-
9
-
10
-
11
-
12
-
13
-
14
-
15
-
16
-
17
-
18
-
19
-
20
-
21
-
22
-
23
-
24
-
25
-
26
-
27
-
28
-
29
-
30
-
31
-
32
-
33
-
34
-
35
-
36
-
37
-
38
-
39
-
40
-
41
-
42
-
43
-
44
-
45
-
46
-
47
-
48
-
49
-
50
-
51
-
52
-
53
-
54
-
55
-
56
-
57
-
58
-
59
-
60
-
61
-
62
-
63
-
64
-
65
-
66
-
67
-
68
-
69
-
70
-
71
-
72
-
73
-
74
-
 75
75 -
 76
76 -
 77
77 -
 78
78 -
 79
79 -
 80
80 -
 81
81 -
 82
82 -
 83
83 -
 84
84 -
 85
85 -
 86
86 -
 87
87 -
 88
88 -
 89
89 -
 90
90 -
 91
91 -
 92
92 -
 93
93 -
 94
94 -
 95
95 -
96
-
97
-
98
-
99
-
100
-
101
-
102
-
103
-
104
-
105
-
106
-
107
-
108
-
109
-
110
-
111
-
112
-
113
-
114
-
115
-
116
-
117
-
118
-
119
-
120
-
121
-
122
-
123
-
124
-
125
-
126
-
127
-
128
-
129
-
130
-
131
-
132
-
133
-
134
-
135
-
136
-
137
-
138
-
139
-
140
-
141
-
142
-
143
-
144
-
145
-
146
-
147
-
148
-
149
-
150
-
151
-
152
-
153
-
154
-
155
-
156
-
157
-
158
-
159
-
160
-
161
-
162
-
163
-
164
-
165
-
166
-
167
-
168
-
169
-
170
-
171
-
172
-
173
-
174
-
175
-
176
-
177
-
178
-
179
-
180
-
181
-
182
-
183
-
184
-
185
-
186
-
187
-
188
-
189
-
190
-
191
-
192
-
193
-
194
-
195
-
196
-
197
-
198
-
199
-
200
-
201
-
202
-
203
-
204
-
205
-
206
-
207
-
208
-
209
-
210
-
211
-
212
-
213
-
214
-
215
-
216
-
217
-
218
-
219
-
220
-
221
-
222
-
223
-
224
-
225
-
226
-
227
-
228
-
229
-
230
-
231
-
232
-
233
-
234
-
235
-
236
-
237
-
238
-
239
-
240
-
241
-
242
-
243
-
244
-
245
-
246
-
247
-
248
-
249
-
250
-
251
-
252
-
253
-
254
-
255
-
256
-
257
-
258
 |
 |

73
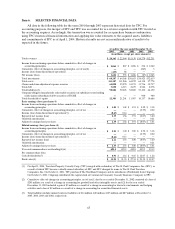
The loss and loss adjustment expense ratio in 2004 included a 4.0 point impact from catastrophes and a
12.6 point impact from net unfavorable prior year reserve development. The respective impacts of these
factors on the2003 loss and loss adjustment expense ratio were 3.8 po ints and 2.8 points. The 2.7 p oint
increase in the underwriting expense ratio in 2004 primarily reflected the impact of higher underwriting
expenses related to the business acquired in the merger, as well as expenses associated with the merger.
Discontinued Operations
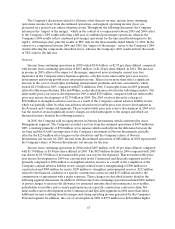
In March 2005, the Company and Nuveen Investments jointly announced that the Company would
implement a program to divest its 78% equity interest in Nuveen Investments, which constituted the
Company’s Asset Management segment and was acquired as part of the merger on April 1, 2004. The
divestiture was completed through a series of transactionsin the second and third quarters of 2005, resulting
in net pretax cash proceeds of $2.40 billion.
The Company recorded a net operating loss from discontinued operationsof $663 million in 2005,
consisting primarily of $710 million of tax expense due to the difference between the tax basis and the GAAP
carrying value of the Company’s investment in Nuveen Investments, partially offset by the Company’s share
of Nuveen Investments’ net income prior to divestiture. The Company recorded a pretax gain on disposal of
$345 million ($224 million after-tax) in 2005. Income from discontinued operations of $88 million in 2004
represented the Company’s share of Nuveen Investments’net income for the year.
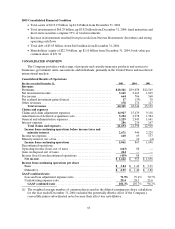
The assets and liabilities related to Nuveen Investments were removed from the respective lines of the
Company’s consolidated balance sheet and reported under the caption “Net assets of discontinued
operations” in the consolidated balance sheet at December 31, 2004. The current and deferred tax liabilities
generated by the difference between the Company’s taxbasis and the GAAP basis of its investment in
Nuveen Investments are reported on the Company’s consolidated balance sheet as part of the Company’s
current and deferred tax liabilities.
Renewal Rights Purchases
During the third quarter of 2003, TPC purchased from Royal & SunAlliance USA (RSA), an unaffiliated
insurer, the renewal rights to RSA’s commercial lines national accounts, middle market and marine
businesses, and standard and preferred personal lines businesses. Also during the third quarter of 2003, TPC
purchased from Atlantic Mutual, an unaffiliated insurer, the renewal rights to the majority of Atlantic
Mutual’s commercial lines inland marineand ocean cargo businesses written by Atlantic Mutual’s Marine
Division. The total purchase price for these renewal rights transactions, which was based in part on the level
of business renewed by the Company, was $69 million.
RESULTS OFOPERATIONS BY SEGMENT
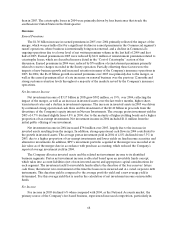
Commercial
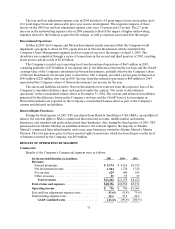
Results of the Company’s Commercial segment were as follows:
(for the year ended December 31, in millions) 2005 2004 2003
Revenues:
Earned premiums ............................. $8,574 $8,816 $6,552
Net investment income ........................ 1,944 1,728 1,324
Fee income................................... 629 680 545
Other revenues ............................... 55 55 33
Total revenues.............................. $ 1 1,202 $ 1 1,279 $8,454
Total claims and expenses........................ $ 1 0,356 $ 1 0,350 $7,131
Operating income ............................... $ 756 $ 786 $1,061
Loss and lossadjustment expense ratio. ............ 83.6% 81.8 % 75.4 %
Underwriting expense ratio. ...................... 29.5 27.8 24.9
GAAP combined ratio ....................... 113.1%109.6 % 100.3 %